- TOP
-
ESG
- Environmental Report
- Data Summary
Data Summary
Employment Data (Parent Company only)
Number of Employees (Each year-end)
| March 2014 | March 2015 | December 2015 |
December 2016 |
December 2017 |
|
|---|---|---|---|---|---|
| Consolidated | 39,427 | 43,583 | 47,324 | 55,843 | 60,064 |
| Non-consolidated | 7,425 | 7,348 | 7,261 | 6,799 | 6,927 |
Employee Composition (December 31, 2017)
| Male | Female | Total | |
|---|---|---|---|
| Executive officers, others | 43 | 2 | 45 |
| Management staff | 1,531 | 136 | 1,667 |
| Non-management staff | 2,575 | 1,028 | 3,603 |
| Contract employees | 269 | 288 | 557 |
| Clerical staff | 1 | 532 | 533 |
| Partners / Senior staff | 117 | 43 | 160 |
| Part-timers, others | 32 | 24 | 56 |
| Seconded from other entities | 211 | 95 | 306 |
| Total | 4,779 | 2,148 | 6,927 |
Employees by Age and Gender (Each year-end)
| March 2014 |
March 2015 |
December 2015 |
December 2016 |
December 2017 |
|
|---|---|---|---|---|---|
| Under 30 years of age | 1,535 | 1,403 | 1,389 | 1,146 | 1,181 |
| 30–39 | 2,682 | 2,618 | 2,576 | 2,346 | 2,424 |
| 40–49 | 1,773 | 1,798 | 1,805 | 1,784 | 1,779 |
| 50–59 | 1,290 | 1,380 | 1,326 | 1,328 | 1,327 |
| 60 years of age and over | 145 | 149 | 165 | 195 | 216 |
| Total | 7,425 | 7,348 | 7,261 | 6,799 | 6,927 |
| Average age | 39.6 | 39.5 | 39.5 | 40.3 | 40.1 |
| Male | 40.9 | 40.8 | 40.9 | 41.8 | 41.8 |
| Female | 36.1 | 36.4 | 36.1 | 36.6 | 36.4 |
| Average length of service (years) | 13.9 | 13.9 | 13.3 | 14.1 | 13.6 |
| Male | 15.5 | 15.4 | 14.8 | 15.8 | 15.6 |
| Female | 9.8 | 10.2 | 9.5 | 9.9 | 9.0 |
Note: Employees on temporary transfer are excluded.
New Graduates Hired
| April 2014 | April 2015 | April 2016 | April 2017 | April 2018 | |
|---|---|---|---|---|---|
| Total | 135 | 132 | 144 | 145 | 145 |
| Male | 91 | 92 | 88 | 82 | 84 |
| Female | 44 | 40 | 56 | 63 | 61 |
| Female Component |
32.6% | 30.3% | 38.9% | 43.4% | 42.0% |
Number of New Graduates and Mid-career Personnel Hired
| FY2013 | FY2014 | FY2015 | FY2016 | FY2017 | |
|---|---|---|---|---|---|
| Total | 169 | 167 | 152 | 176 | 244 |
| Male | 114 | 120 | 108 | 115 | 158 |
| Female | 55 | 47 | 44 | 61 | 86 |
| Female Component |
32.5% | 28.1% | 28.9% | 34.7% | 35.2% |
Ratio of Women among Managers
| 2015 | 2016 | 2017 | |
|---|---|---|---|
| Total | 7.5 | 7.8 | 8.0 |
Note: including personnel seconded to the Company and excluding personel seconded from the Company
Work–Life Balance
Average Number of Paid Vacation Days Taken
| FY2013 | FY2014 | FY2015(※) | FY2016 | FY2017 | |
|---|---|---|---|---|---|
| Total | 10.3 | 10.8 | 8.4 | 11.2 | 12.8 |
| Male | 9.2 | 9.6 | 7.5 | 10.2 | 12.1 |
| Female | 13.1 | 13.8 | 10.6 | 13.9 | 14.5 |
| Leave Taken | 51.5% | 54.0% | 42.0% | 56.0% | 64.0% |
Annual Paid Vacation in Hour Increments Taken
(Part of paid vacation days)
| FY2013 | FY2014 | FY2015(※) | FY2016 | FY2017 | |
|---|---|---|---|---|---|
| Total Hours Taken | 45,005 | 49,712 | 38,275 | 47,138 | 49,459 |
| Total Number of People Taking Leave | 17,111 | 14,568 | 14,308 | 18,217 | 19,401 |
| Number of Hours Taken at One Time | 2.6 | 3.4 | 2.7 | 2.6 | 2.5 |
Employees Taking Childcare Leave, Reinstatement Ratio
| FY2013 | FY2014 | FY2015(※) | FY2016 | FY2017 | |
|---|---|---|---|---|---|
| Total | 51 | 60 | 81 | 81 | 106 |
| Male | 11 | 10 | 15 | 31 | 47 |
| Female | 40 | 50 | 66 | 50 | 59 |
| Reinstatement ratio |
96.1% | 100% | 100% | 100% | 100% |
Note: In FY2014, we recounted the number of the employees who took childcare leave in the past and revised the number in conjunction with the reinstatement ratio.
Total Hours Worked per Year (Per Non-management Employees)
| FY2013 | FY2014 | FY2015(※) | FY2016 | FY2017 | |
|---|---|---|---|---|---|
| Total | 2,265 | 2,252 | 2,187 | 2,166 | 2,031 |
Note: 1. Employees on temporary transfer are excluded.
2. Following the change in the working hours management, the number of actual working hours has been revised from FY2017
3. Including management positions from FY2017.
Occupational Health and Safety
Employees’ Health Check Rate
| FY2013 | FY2014 | FY2015(※) | FY2016 | FY2017 | |
|---|---|---|---|---|---|
| Total | 99.2% | 99.0% | 76.1% | 95.5% | 96.6% |
Social Contribution Activities
Community Investment
| Cash Donations |
Time Donations |
In-kind Donations |
Management costs of CSR |
total | |
|---|---|---|---|---|---|
| DAN | 689,463 | 2,188,574 | 8,632,475 | 432,090 | 11,942,602 |
(Unit : British Pound)
Leveraging Diverse Human Resources
Number of post-retirement employees
| FY2013 | FY2014 | FY2015(※) | FY2016 | FY2017 | |
|---|---|---|---|---|---|
| Total | 32 | 55 | 53 | 46 | 51 |
| Male | 22 | 45 | 44 | 35 | 41 |
| Female | 10 | 10 | 9 | 11 | 10 |
Employment Rate of People with Disabilities
| June 2014 | June 2015 | June 2016 | June 2017 | June 2018 | |
|---|---|---|---|---|---|
| Total | 1.79 | 2.01 | 2.04 | 2.07 | 2.14 |
(Unit : %)
Employee Engagement Survey
Survey on the Company and Work
| January 2014 |
January 2015 |
January 2016 |
January 2017 |
January 2018 |
|
|---|---|---|---|---|---|
| Q.Have you gained experience and knowledge made possible only by working at Dentsu? |
94.0 | 95.1 | 94.4 | 93.2 | 92.3 |
| Q.Are you proud to work at Dentsu? | 87.3 | 88.1 | 86.8 | 80.2 | 78.4 |
| Q.Going forward, do you want to continue working at Dentsu? |
78.9 | 78.5 | 75.6 | 73.5 | 72.1 |
(Unit : %)
Environmental Performance Data
| FY2015 | FY2016 | FY2017 | ||
|---|---|---|---|---|
| CO2 emissions (tons) | 109,840 | 124,698 | 113,134 | |
| Dentsu (non-consolidated) | 29,188 | 30,886 | 28,991 | |
| Dentsu Group in Japan | 19,360 | 18,584 | 16,443 | |
| DAN (Dentsu Group Overseas) | 61,292 | 75,229 | 67,700 | |
| CO2 emissions per FTE | 2.49 | 2.42 | 2.11 | |
| Scope 1 (tons) | 4,482 | 5,170 | 5,611 | |
| Dentsu (non-consolidated) | 577 | 594 | 452 | |
| Dentsu Group in Japan | 310 | 409 | 417 | |
| DAN (Dentsu Group Overseas) | 3,595 | 4,166 | 4,742 | |
| Scope 2 (market-based, tons) | 53,836 | 55,126 | 48,573 | |
| Dentsu (non-consolidated) | 20,938 | 21,867 | 20,287 | |
| Dentsu Group in Japan | 11,432 | 10,496 | 8,258 | |
| DAN (Dentsu Group Overseas) | 21,466 | 22,762 | 20,028 | |
| Scope 3 (tons) | 51,523 | 64,403 | 58,949 | |
| 1.Purchased goods and services | 4,844 | 3,066 | 2,396 | |
| 5.Waste generated in operations | 884 | 933 | 1,110 | |
| 6.Business travel | 42,460 | 57,372 | 52,603 | |
| 7.Employee commuting | 3,334 | 3,030 | 2,841 | |
| 1.Purchased goods and services | 4,533 | 4,844 | 3,066 | |
| 5.Waste generated in operations | 588 | 884 | 933 | |
| 6.Business travel | 38,438 | 42,460 | 57,372 | |
| 7.Employee commuting | 3,399 | 3,334 | 3,030 | |
| Amount of waste (kg) | 6,790,003 | 6,768,018 | 6,658,385 | |
| Dentsu (non-consolidated) | 2,456,855 | 3,224,884 | 2,877,632 | |
| Dentsu Group in Japan | 1,105,180 | 1,292,447 | 1,444,553 | |
| DAN (Dentsu Group Overseas) | 3,227,968 | 2,250,687 | 2,336,200 | |
| Water consumption (m³) | 785,193 | 853,583 | 458,786 | |
| Dentsu (non-consolidated) | 152,452 | 155,741 | 133,048 | |
| Dentsu Group in Japan | 215,825 | 230,391 | 143,299 | |
| DAN (Dentsu Group Overseas) | 416,916 | 467,451 | 182,439 |
- Excluding some of Dentsu Group companies
- Based on the calculation standards of WRI (World Resources Institute) GHG Protocol
- For CO2 emissions, Categories 1, 5, 6, and 7 were calculated for Scope 3
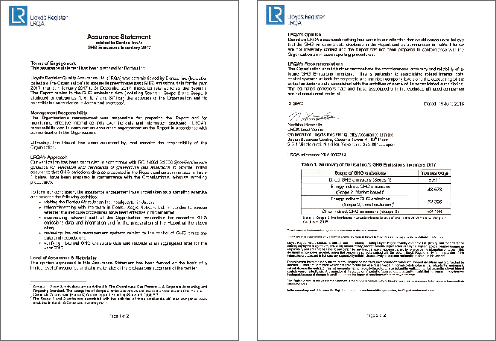
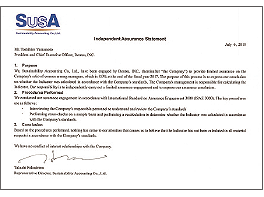
Third-Party Assurance
-
Lloyd’s Register Quality Assurance Limited (LRQA) provides third-party assurance on Dentsu’s CO2 emissions (greenhouse gas emissions).
-
The percentage of women in management, the percentage of women in new-graduate hires, and the employment rate of people with disabilities have received third-party verification from Sustainability Accounting Co., Ltd. (SusA).

Note: “Executive officers, others” indicates senior corporate advisors, special advisors and executive officers (excluding Directors and Audit and Supervisory Committee Member). “Part-timers, others” indicates permanent part-timers, non-permanent part-timers and employees of overseas branches.
Note: Employees on temporary transfer are excluded.