


- Consolidated
- Non-Consolidated
Millions of yen
except
per share data
| Dentsu Inc. Years ended March 31 |
2011/3 |
2012/3 |
2013/3 |
2014/3 |
2015/3 |
|---|---|---|---|---|---|
| For the year: | |||||
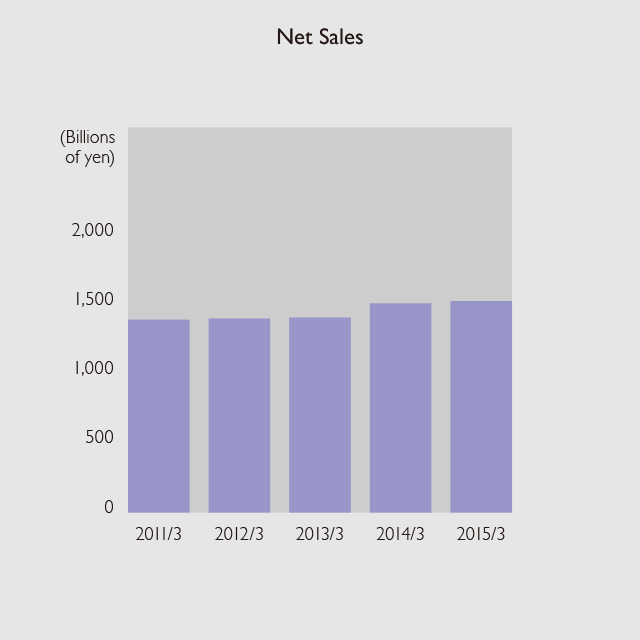
| Net sales | 1,396,798 | 1,404,663 | 1,412,376 | 1,515,062 | 1,535,105 |
| Cost of sales | 1,203,669 | 1,210,027 | 1,214,508 | 1,295,669 | 1,311,939 |
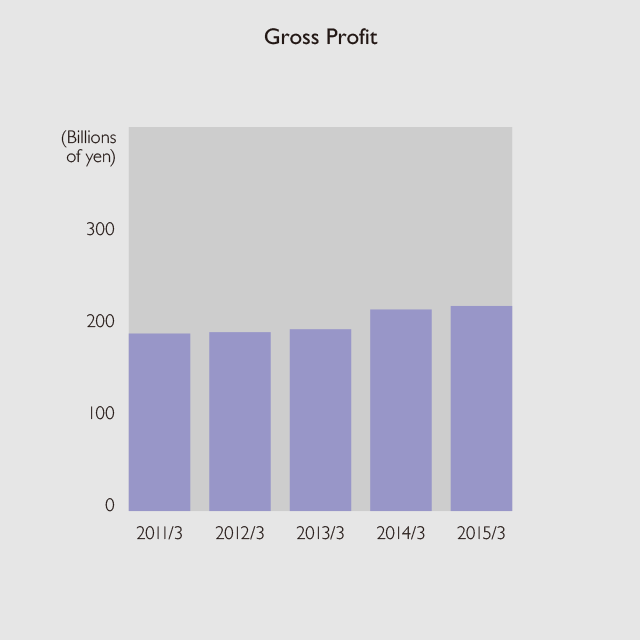
| Gross profit | 193,129 | 194,636 | 197,867 | 219,393 | 223,165 |
| Selling, general and administrative expenses | 159,329 | 162,942 | 162,101 | 168,813 | 170,743 |
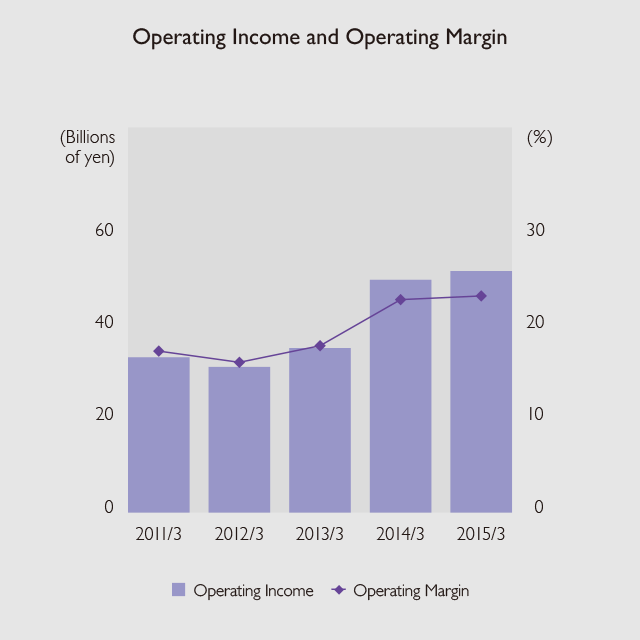
| Operating income | 33,799 | 31,693 | 35,766 | 50,579 | 52,421 |
| Ordinary income | 40,312 | 40,654 | 39,091 | 69,667 | 76,458 |
| Income before income taxes | 26,551 | 61,642 | 42,489 | 68,361 | 88,424 |
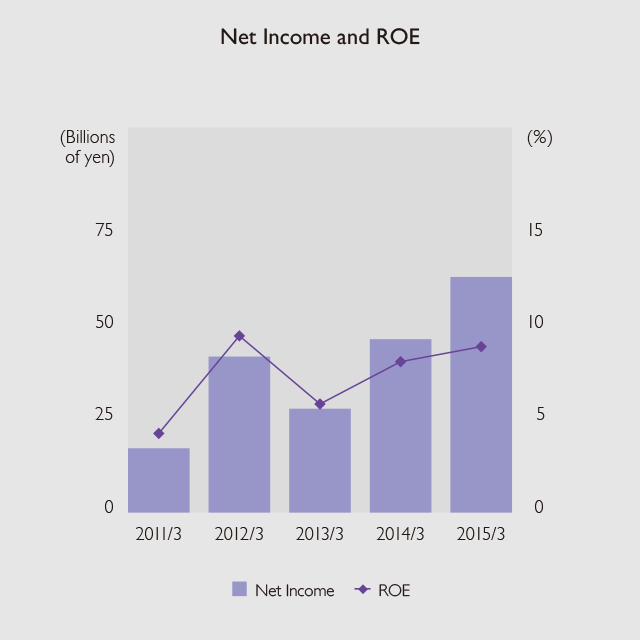
| Net income | 17,471 | 42,212 | 28,189 | 46,953 | 63,950 |
| At year-end: | |||||
| Total assets | 1,011,538 | 1,065,664 | 1,409,387 | 1,482,661 | 1,649,418 |
| Total shareholders’ equity | 415,206 | 463,098 | 492,505 | 651,629 | 776,525 |
| Per share data (yen): | |||||
| Net income | 70.12 | 169.42 | 113.14 | 170.49 | 221.77 |
| Cash dividends | 29.5 | 31 | 32 | 33 | 55 |
| Ratios (%): | |||||
| Operating margin(1) | 17.5 | 16.3 | 18.1 | 23.1 | 23.5 |
| Return on equity (ROE)(2) | 4.3 | 9.6 | 5.9 | 8.2 | 9.0 |
| Return on assets (ROA)(3) | 4.0 | 3.9 | 3.2 | 4.8 | 4.9 |
| Equity ratio(4) | 41.0 | 43.5 | 34.9 | 44.0 | 47.1 |
| Dividend payout ratio(5) | 42.1 | 18.3 | 28.3 | 19.4 | 24.8 |
- Notes:
-
- (1)
- Operating margin = Operating income ÷ Gross profit × 100
- (2)
- ROE = Net income ÷ Average total shareholders’ equity based on total shareholders’ equity at the beginning and end of the fiscal year × 100
- (3)
- ROA = Ordinary income ÷ Average total assets based on total assets at the beginning and end of the fiscal year × 100
- (4)
- Equity ratio = Total shareholders’ equity ÷ Total assets × 100
- (5)
- Dividend payout ratio = Cash dividend per share ÷ Net income per share × 100
-
![Net Sales]()
(Years ended March 31)
-
![Gross Profit]()
(Years ended March 31)
-
![Operating Income and Operating Margin]()
(Years ended March 31)
-
![Net Income and ROE]()
(Years ended March 31)