Strategy
Dentsu Inc. and Consolidated Subsidiaries
| Consolidated (Financial reporting basis) IFRS | Consolidated (Calendar year basis (pro forma)) IFRS | ||||
|---|---|---|---|---|---|
| 2015/3 | 2015/12 | 2014 | 2015 | 2016 | |
| Turnover | 4,642,390 | 4,513,955 | 4,642,901 | 4,990,854 | 4,924,933 |
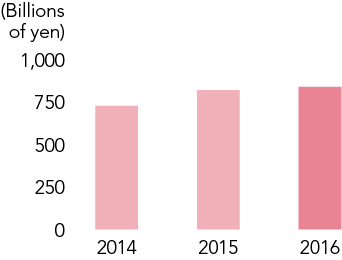
| Revenue | 728,626 | 706,469 | 725,886 | 818,566 | 838,359 |
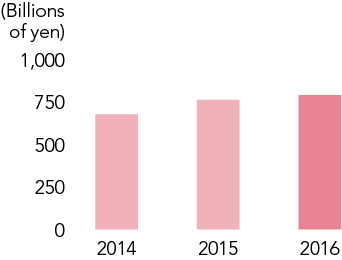
| Gross profit | 676,925 | 669,489 | 676,882 | 761,996 | 789,043 |
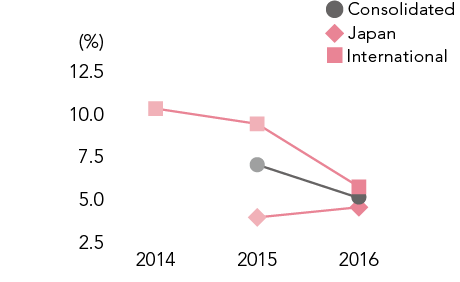
| Organic gross profit growth rate(1) Consolidated | 5.8% | - | - | 7.0% | 5.1% |
| Organic gross profit growth rate Japan | 2.2% | - | - | 3.9% | 4.5% |
| Organic gross profit growth rate International | 10.3% | 9.4% | 10.3% | 9.4% | 5.7% |
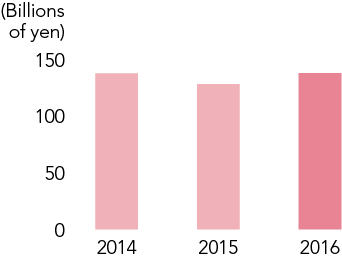
| Operating profit | 132,305 | 107,265 | 137,558 | 128,212 | 137,681 |
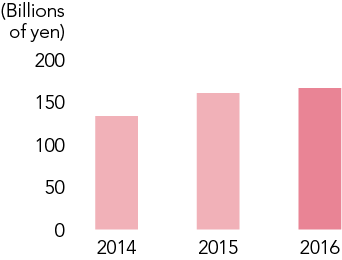
| Underlying operating profit(2) | 131,937 | 133,328 | 133,402 | 160,438 | 166,565 |
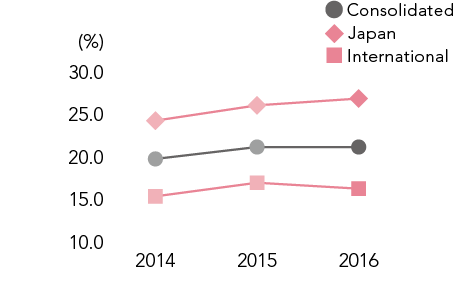
| Operating margin(3) Consolidated | 19.5% | 19.9% | 19.7% | 21.1% | 21.1% |
| Operating margin Japan | 23.9% | 24.7% | 24.2% | 26.0% | 26.8% |
| Operating margin International | 15.3% | 16.9% | 15.3% | 16.9% | 16.2% |
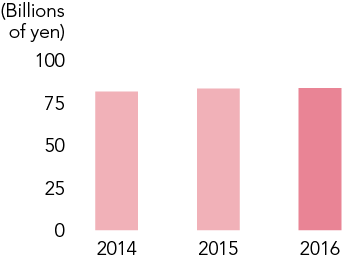
| Profit for the year attributable to owners of the parent | 79,846 | 72,653 | 81,409 | 83,090 | 83,501 |
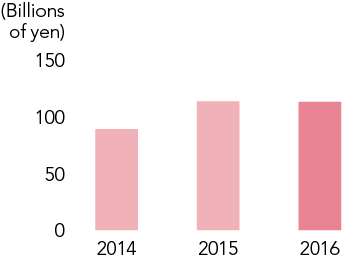
| Underlying net profit(4) | 92,875 | 94,368 | 89,179 | 113,388 | 112,972 |
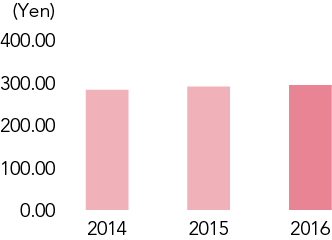
| Basic earnings per share | 276.89円 | 254.05円 | 282.31円 | 289.95円 | 292.85円 |
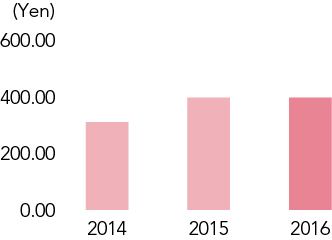
| Basic underlying net profit per share | 322.08円 | 329.98円 | 309.26円 | 395.67円 | 396.20円 |
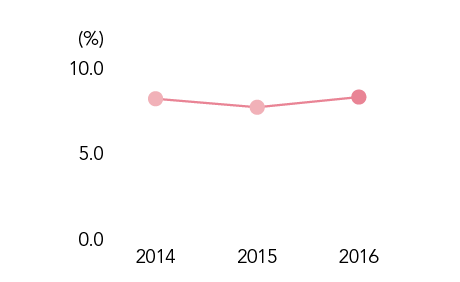
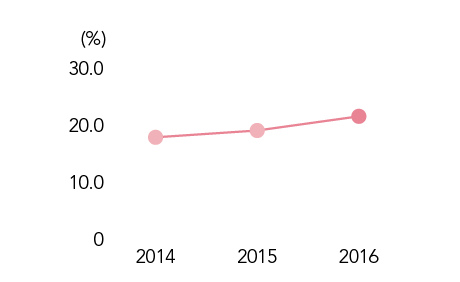
| Return on equity (ROE)(5) | 8.1% | 6.8% | 8.2% | 7.7% | 8.3% |
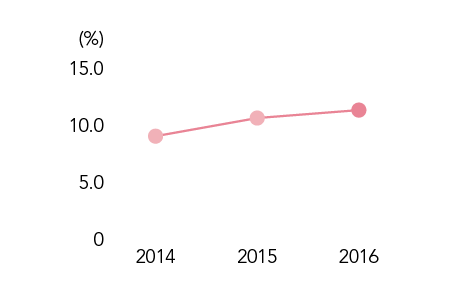
| Underlying ROE | 9.4% | 8.8% | 9.0% | 10.6% | 11.3% |
| ROA(6) | 4.6% | 3.4% | - | - | 4.4% |
| Ratio of equity attributable to owners of the parent(7) | 34.2% | 34.8% | - | 34.8% | 29.6% |
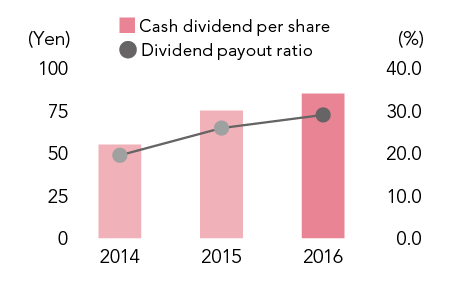
| Cash dividend per share | 55円 | 75円 | 55円 | 75円 | 85円 |
| Dividend payout ratio(8) | 19.9% | 29.5% | 19.5% | 25.9% | 29.0% |
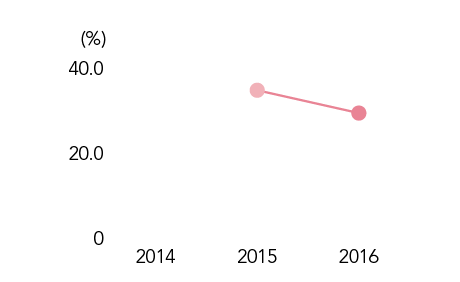
| Underlying dividend payout ratio | 17.1% | 22.7% | 17.8% | 19.0% | 21.5% |
Effective from fiscal 2015, the Company and its subsidiaries with fiscal year-ends other than December 31 have changed their fiscal year-ends to December 31. As a result of this change, the Group’s consolidated fiscal year-end date has been changed from March 31 to December 31, and fiscal 2015 is the nine-month period from April 1, 2015 to December 31, 2015. However, since the fiscal year-end date of Dentsu Aegis Network Ltd. and its subsidiaries, which operate the Group’s international business, was already December 31, the financial results of these companies for the twelve-month period from January 1, 2015 to December 31, 2015 have been consolidated into the Group’s consolidated financial results. [On a financial reporting basis for 2015/12]
As reference figures for the purpose of making comparisons, figures calculated on the assumption that the Group’s accounting periods for both fiscal 2014 and fiscal 2015 covered January 1 to December 31 are provided. [On a calendar year basis] Figures for fiscal 2016 from the period covering January 1 to December 31 are provided on a financial reporting basis.
| 2014 | 2015 | |||||||
|---|---|---|---|---|---|---|---|---|
| Jan. - Mar. |
Apr. – Jun. |
Jul. – Sep. |
Oct. – Dec |
Jan. - Mar. |
Apr. – Jun. |
Jul. – Sep. |
Oct. – Dec |
|
| Japan business |
2015/3 (Financial reporting basis) |
2015/12 (Financial reporting basis) |
||||||
| International business |
||||||||
| 2014and2015 | 2016 | |||||||
|---|---|---|---|---|---|---|---|---|
| Jan. - Mar. |
Apr. – Jun. |
Jul. – Sep. |
Oct. – Dec |
Jan. - Mar. |
Apr. – Jun. |
Jul. – Sep. |
Oct. – Dec |
|
| Japan business |
2014 & 2015 (Pro forma basis) |
2016/12 (Financial reporting basis) |
||||||
| International business |
||||||||
Revenue
Gross Profit
Organic Gross Profit Growth Rate
Operating Profit
Underlying Operating Profit
Operating Margin
Profit for the Year Attributable to Owners of the Parent
Underlying Net Profit
Basic Earnings per Share
Basic Underlying Net Profit per Share
Return on Equity (ROE)
Underlying ROE
Ratio of Equity Attributable to Owners of the Parent
Cash Dividend per Share/Dividend Payout Ratio
Underlying Dividend Payout Ratio
© DENTSU GROUP INC. ALL RIGHTS RESERVED.

We use cookies to improve your experience and our services. We also share information about your use of our website with our analytics partners. You can change your cookies settings, please see our Cookie Policy. Otherwise, if you agree to our use of cookies, please continue to use our website.