| March 2013 | March 2014 | March 2015 | December 2015 | December 2016 | |
|---|---|---|---|---|---|
| Consolidated | 37,450 | 39,427 | 43,583 | 47,324 | 55,843 |
| Non-consolidated | 7,515 | 7,425 | 7,348 | 7,261 | 6,799 |
| Male | Female | Total | |
|---|---|---|---|
| Executive officers, others |
38 | 0 | 38 |
| Management staff | 1,532 | 140 | 1,672 |
| Non-management staff |
2,673 | 1,020 | 3,693 |
| Contract employees | 250 | 214 | 464 |
| Clerical staff | 1 | 506 | 507 |
| Partners / Senior staff |
105 | 41 | 146 |
| Part-timers, others | 25 | 14 | 39 |
| Seconded from other entities |
184 | 56 | 240 |
| Total | 4,808 | 1,991 | 6,799 |
| March 2013 | March 2014 | March 2015 | December 2015 | December 2016 | |
|---|---|---|---|---|---|
| Under 30 years of age |
1,593.0 | 1,535.0 | 1,403.0 | 1,389.0 | 1,146.0 |
| 30–39 | 2,727.0 | 2,682.0 | 2,618.0 | 2,576.0 | 2,346.0 |
| 40–49 | 1,803.0 | 1,773.0 | 1,798.0 | 1,805.0 | 1,784.0 |
| 50–59 | 1,252.0 | 1,290.0 | 1,380.0 | 1,326.0 | 1,328.0 |
| 60 years of age and over |
140.0 | 145.0 | 149.0 | 165.0 | 195.0 |
| Total | 7,515.0 | 7,425.0 | 7,348.0 | 7,261.0 | 6,799.0 |
| Average age | 38.9 | 39.6 | 39.5 | 39.5 | 40.3 |
| Male | 40.1 | 40.9 | 40.8 | 40.9 | 41.8 |
| Female | 36.0 | 36.1 | 36.4 | 36.1 | 36.6 |
| Average length of service (years) | 13.1 | 13.9 | 13.9 | 13.3 | 14.1 |
| Male | 14.7 | 15.5 | 15.4 | 14.8 | 15.8 |
| Female | 9.3 | 9.8 | 10.2 | 9.5 | 9.9 |
Note: Employees on temporary transfer are excluded.
| April 2013 | April 2014 | April 2015 | April 2016 | April 2017 | |
|---|---|---|---|---|---|
| Total | 136 | 135 | 132 | 144 | 145 |
| Male | 93 | 91 | 92 | 88 | 82 |
| Female | 43 | 44 | 40 | 56 | 63 |
| Female Component |
31.6% | 32.6% | 30.3% | 38.9% | 43.4% |
| FY2012 | FY2013 | FY2014 | FY2015 | FY2016 | |
|---|---|---|---|---|---|
| Total | 224 | 169 | 167 | 152 | 176 |
| Male | 151 | 114 | 120 | 108 | 115 |
| Female | 73 | 55 | 47 | 44 | 61 |
| Female Component |
32.6% | 32.5% | 28.1% | 28.9% | 34.7% |
| Total | 7.82%(including personnel seconded to the Company and excluding personnel seconded from the Company) |
| FY2012 | FY2013 | FY2014 | FY2015* | FY2016 | |
|---|---|---|---|---|---|
| Total | 10.6 | 10.3 | 10.8 | 8.4 | 11.2 |
| Male | 9.7 | 9.2 | 9.6 | 7.5 | 10.2 |
| Female | 12.9 | 13.1 | 13.8 | 10.6 | 13.9 |
| Leave Taken | 53.0% | 51.5% | 54.0% | 42.0% | 56.0% |
| FY2012 | FY2013 | FY2014 | FY2015* | FY2016 | |
|---|---|---|---|---|---|
| Total Hours Taken | 42,994 | 45,005 | 49,712 | 38,275 | 47,138 |
| Total Number of People Taking Leave | 16,161 | 17,111 | 14,568 | 14,308 | 18,217 |
| Number of Hours Taken at One Time | 2.7 | 2.6 | 3.4 | 2.7 | 2.6 |
| FY2012 | FY2013 | FY2014 | FY2015* | FY2016 | |
|---|---|---|---|---|---|
| Total | 44 | 51 | 60 | 81 | 81 |
| Male | 8 | 11 | 10 | 15 | 31 |
| Female | 36 | 40 | 50 | 66 | 50 |
| Reinstatement ratio | 95.5% | 96.1% | 100% | 100% | 100% |
Note: In FY2014, we recounted the number of the employees who took childcare leave in the past and revised the number in conjunction with the reinstatement ratio.
| FY2012 | FY2013 | FY2014 | FY2015* | FY2016 | |
|---|---|---|---|---|---|
| Total | 2,251 | 2,265 | 2,252 | 2,187 | 2,166 |
Note: Employees on temporary transfer are excluded.
| FY2012 | FY2013 | FY2014 | FY2015* | FY2016 | |
|---|---|---|---|---|---|
| Total | 99.1% | 99.2% | 99.0% | 76.1% | 95.5% |
| FY2012 | FY2013 | FY2014 | FY2015* | FY2016 | |
|---|---|---|---|---|---|
| Total | 28 | 32 | 55 | 53 | 46 |
| Male | 21 | 22 | 45 | 44 | 35 |
| Female | 7 | 10 | 10 | 9 | 11 |
| June 2013 | June 2014 | June 2015 | June 2016 | June 2017 | |
|---|---|---|---|---|---|
| Total | 1.62% | 1.79% | 2.01% | 2.04% | 2.07% |
Note: The June 2013 figure is for Dentsu on a non-consolidated basis. Figures for June 2014, 2015, 2016, and 2017 are three-company totals, for Dentsu, Dentsu Works, and Dentsu Solari.
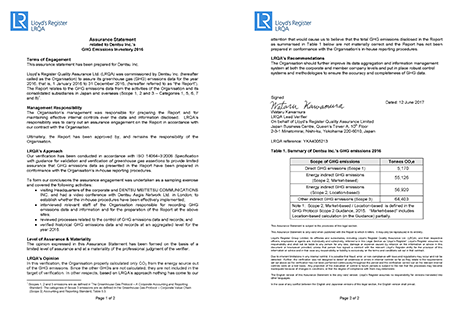
| FY2014 | FY2015 | FY2016 | ||
|---|---|---|---|---|
| CO2 emissions (tons) | 110,202 | 109,840 | 124,698 | |
| Dentsu (non-consolidated) | 32,338 | 29,188 | 30,886 | |
| Dentsu Group in Japan | 24,150 | 19,360 | 18,584 | |
| DAN (Dentsu Group Overseas) | 53,713 | 61,292 | 75,229 | |
| CO2 emissions per FTE | 2.74 | 2.49 | 2.42 | |
| Scope 1 (tons) | 4,799 | 4,482 | 5,170 | |
| Dentsu (non-consolidated) | 570 | 577 | 594 | |
| Dentsu Group in Japan | 648 | 310 | 409 | |
| DAN (Dentsu Group Overseas) | 3,581 | 3,595 | 4,166 | |
| Scope 2 (market-based, tons) | - | 53,836 | 55,126 | |
| Dentsu (non-consolidated) | - | 20,938 | 21,867 | |
| Dentsu Group in Japan | - | 11,432 | 10,496 | |
| DAN (Dentsu Group Overseas) | - | 21,466 | 22,762 | |
| Scope 2 (location-based, tons) | 58,444 | 56,349 | 56,920 | |
| Dentsu (non-consolidated) | 22,949 | 20,938 | 21,867 | |
| Dentsu Group in Japan | 15,753 | 11,432 | 10,496 | |
| DAN (Dentsu Group Overseas) | 19,742 | 23,979 | 24,556 | |
| Scope 3 (tons) | 46,958 | 51,523 | 64,403 | |
| 1. Purchased goods and services | 4,533 | 4,844 | 3,066 | |
| 5. Waste generated in operations | 588 | 884 | 933 | |
| 6. Business travel | 38,438 | 42,460 | 57,372 | |
| 7. Employee commuting | 3,399 | 3,334 | 3,030 | |
| Amount of waste (kg) | 5,623,750 | 6,790,003 | 6,768,018 | |
| Dentsu (non-consolidated) | 2,195,858 | 2,456,855 | 3,224,884 | |
| Dentsu Group in Japan | 1,828,000 | 1,105,180 | 1,292,447 | |
| DAN (Dentsu Group Overseas) | 1,599,892 | 3,227,968 | 2,250,687 | |
| Water consumption (m³) | 618,694 | 785,193 | 853,583 | |
| Dentsu (non-consolidated) | 153,852 | 152,452 | 155,741 | |
| Dentsu Group in Japan | 222,856 | 215,825 | 230,391 | |
| DAN (Dentsu Group Overseas) | 241,986 | 416,916 | 467,451 | |
Lloyd’s Register Quality Assurance Limited (LRQA) provides third-party assurance on Dentsu’s CO2 emissions (greenhouse gas emissions).
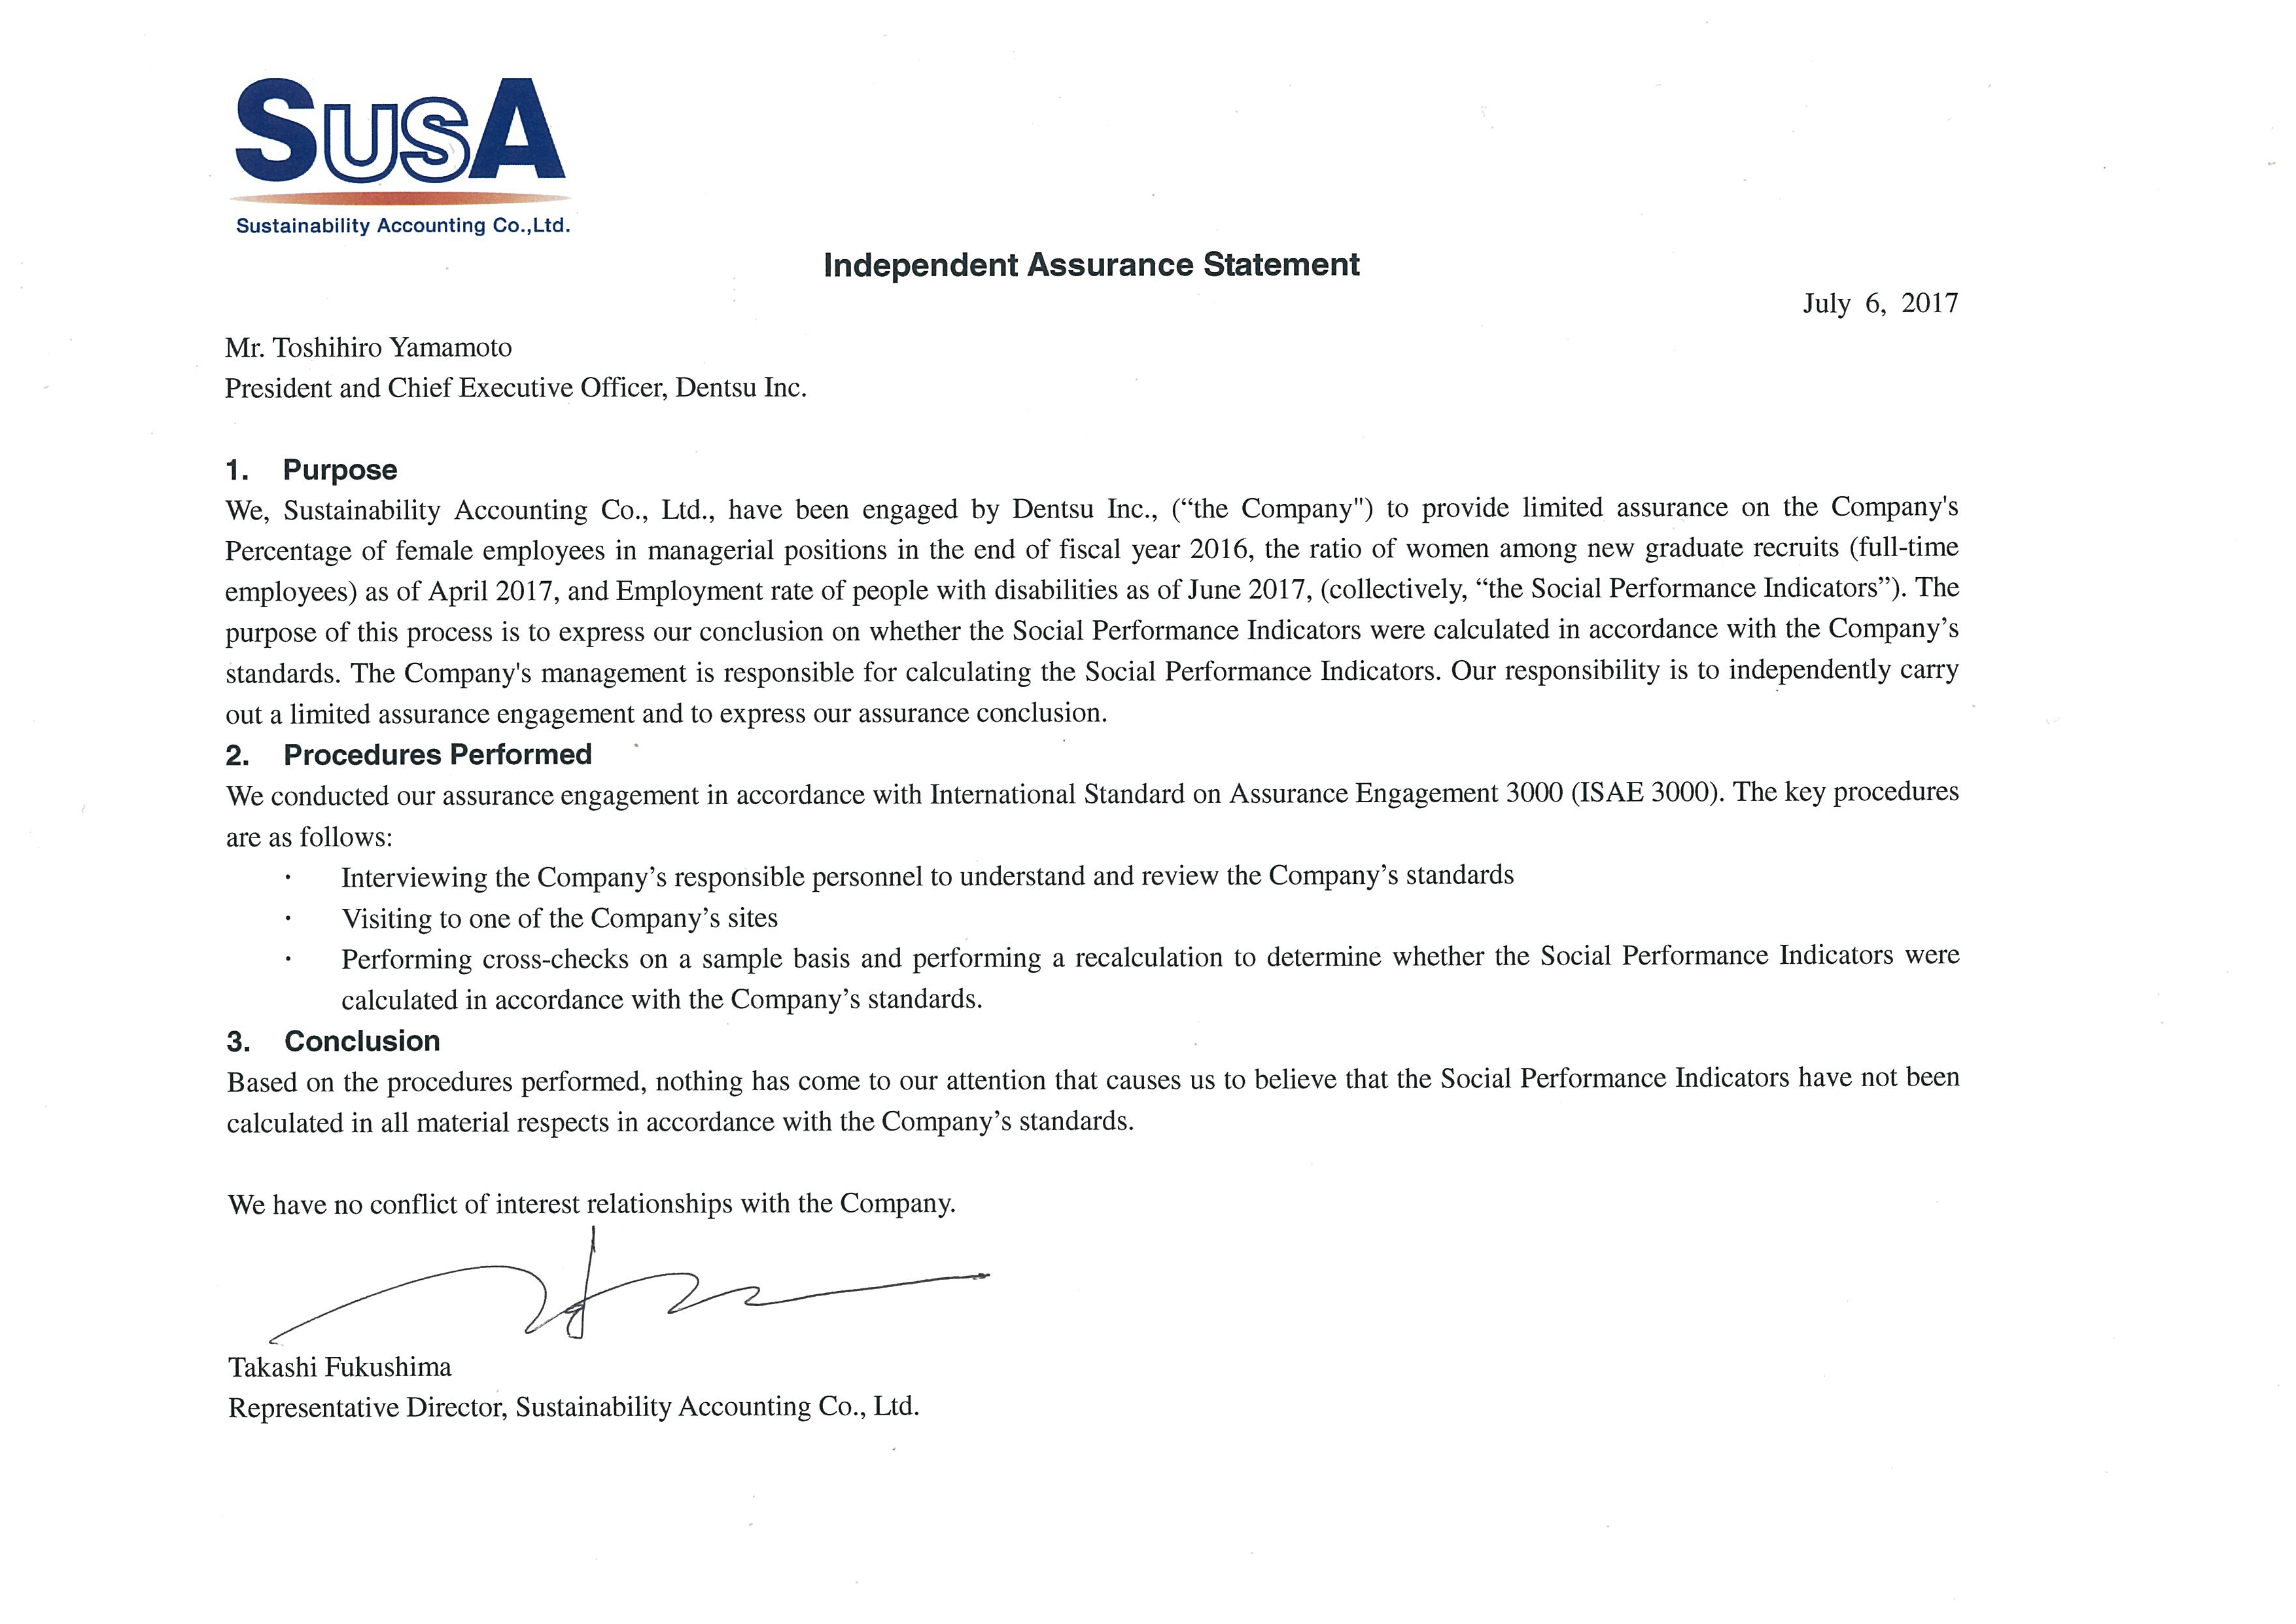
The percentage of women in management, the percentage of women in new-graduate hires, and the employment rate of people with disabilities have received third-party verification from Sustainability Accounting Co., Ltd. (SusA).
© DENTSU GROUP INC. ALL RIGHTS RESERVED.

We use cookies to improve your experience and our services. We also share information about your use of our website with our analytics partners. You can change your cookies settings, please see our Cookie Policy. Otherwise, if you agree to our use of cookies, please continue to use our website.
Note: “Executive officers, others” indicates senior corporate advisors, special advisors and executive officers (excluding directors and auditors). “Parttimers, others” indicates permanent part-timers, non-permanent parttimers and employees of overseas branches.
Note: Employees on temporary transfer are excluded.