


Consolidated Financial Highlights
In fiscal 2014 (April 1, 2014 to March 31, 2015), the Group adopted the International Financial Reporting Standards (IFRS) in place of the previously used Japanese GAAP with the intent of improving international comparability, and the statements are based on disclosure items in accordance with IFRS. For the purpose of year-on-year comparison, the results for fiscal 2013 (April 1, 2013 to March 31, 2014) are also shown in accordance with IFRS.
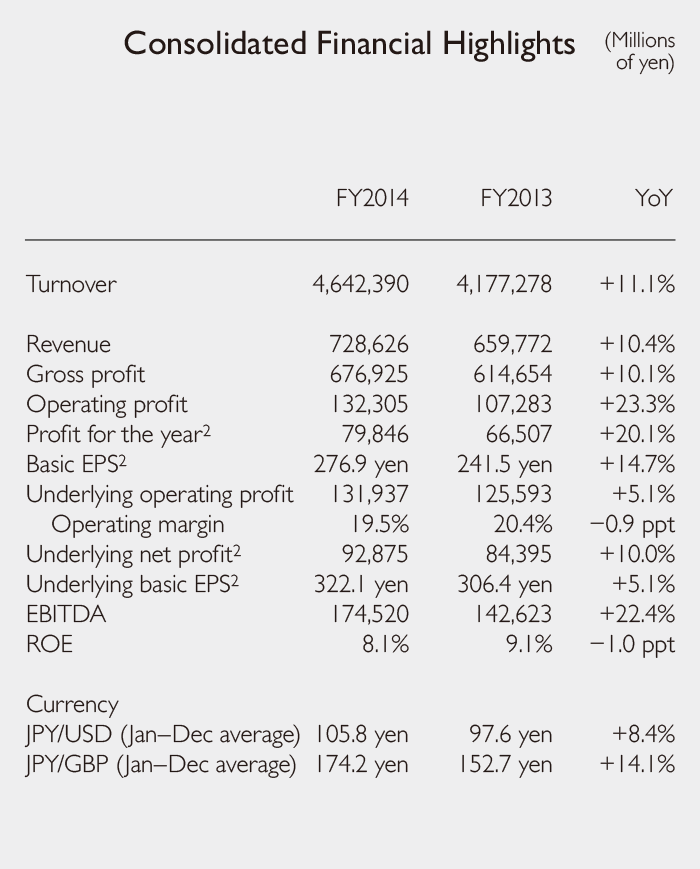
For fiscal 2014, the Group posted 728.6 billion yen in revenue (a 10.4% increase year on year), 676.9 billion yen in gross profit (a 10.1% increase), 131.9 billion yen in underlying operating profit (a 5.1% increase), 132.3 billion yen in operating profit (a 23.3% increase), and 79.8 billion yen in profit for the year attributable to owners of the parent (a 20.1% increase).
In applying IFRS, we have set “underlying operating profit,” a recurring profit indicator, as a KPI. “Underlying operating profit” is calculated by eliminating from operating profit certain one-off items, including amortization of M&A-related intangible assets, impairment loss, gain/loss on sales of non-current assets, and acquisition costs. Accordingly, operating margin is calculated utilizing “underlying operating profit” instead of “adjusted operating income (operating income before amortization of goodwill and other intangible assets).”
With regard to profit for the year, we calculate “underlying net profit” as a KPI to measure recurring profit for the year attributable to owners of the parent. “Underlying net profit attributable to owners of the parent” is profit for the year attributable to owners of the parent added with adjustment items related to operating profit, revaluation of earnout liabilities/M&A-related put-option liabilities, and tax-related and other one-off items.
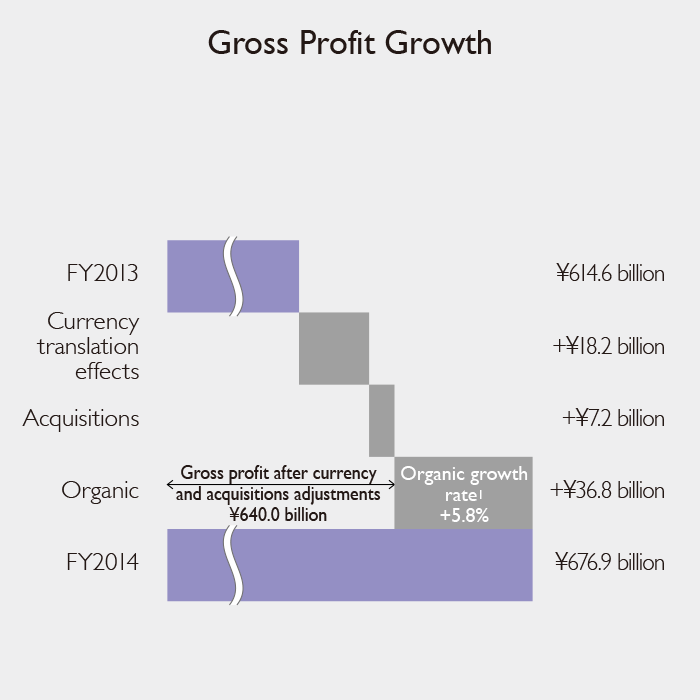
Gross profit in fiscal 2014 increased 62.3 billion yen from the previous fiscal year, to 676.9 billion yen, of which the currency translation effect accounted for 18.2 billion yen and acquisition effects accounted for 7.2 billion yen. Actual growth, excluding the effects of currency translation and acquisitions, was 36.8 billion yen, and the gross profit organic growth rate1 for the entire Group was 5.8%.
- 1
- Organic growth rate: Internal growth rate factoring out acquisitions and the effect of exchange rates
- 2
- Profit for the year, Basic EPS, Underlying net profit and Underlying basic EPS: Attributable to owners of the parent
Regional Information
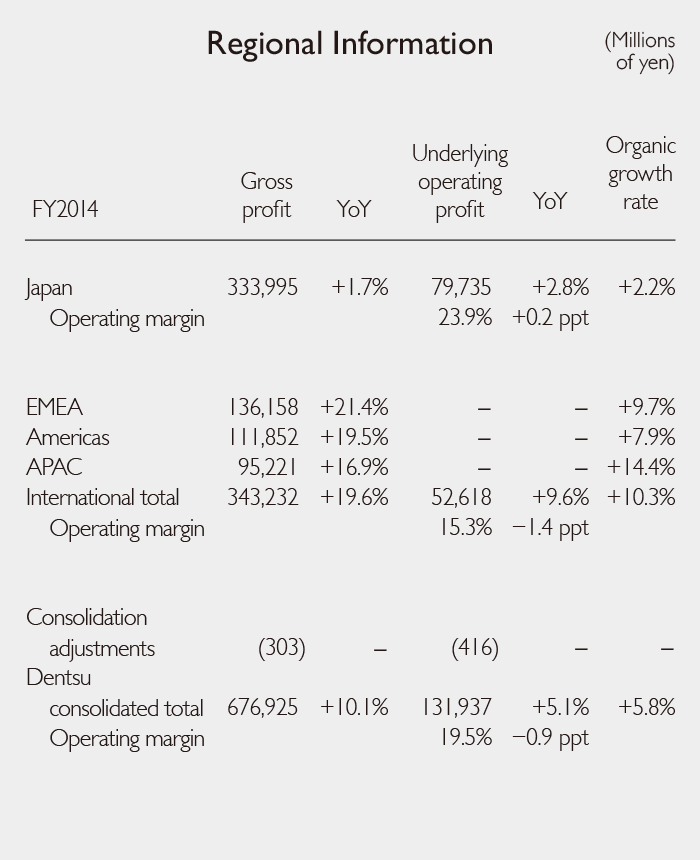
Gross profit from the Group’s Japan business operations increased 1.7% from the previous fiscal year, to 333.9 billion yen, marking a record high level of gross profit on a non-consolidated basis. Underlying operating profit increased 2.8%, to 79.7 billion yen, and the operating margin based on underlying operating profit was 23.9%, up 0.2 percentage points (ppt) year on year.
As for the Group’s international business operations, Europe, the Middle East and Africa (EMEA) outperformed market growth significantly, with gross profit rising 21.4% over the previous fiscal year, to 136.1 billion yen. In the Americas, gross profit increased 19.5%, to 111.8 billion yen, with a significant contribution from the effect of M&A; and in Asia Pacific, excluding Japan (APAC), gross profit rose 16.9%, to 95.2 billion yen, mainly due to favorable results in the Chinese market. As a result, total gross profit from our international business operations showed robust growth, increasing 19.6% to 343.2 billion yen, and the gross profit international ratio reached 50.7%, exceeding that of our Japan business for the first time.
Meanwhile, although underlying operating profit from our international business operations grew 9.6% from the previous fiscal year, to 52.6 billion yen, an increase in platform investments to strengthen management at Dentsu Aegis Network resulted in an operating margin of 15.3%, down 1.4 ppt.
As a result, the consolidated operating margin for the Dentsu Group in fiscal 2014 was 19.5%.
Financial Position
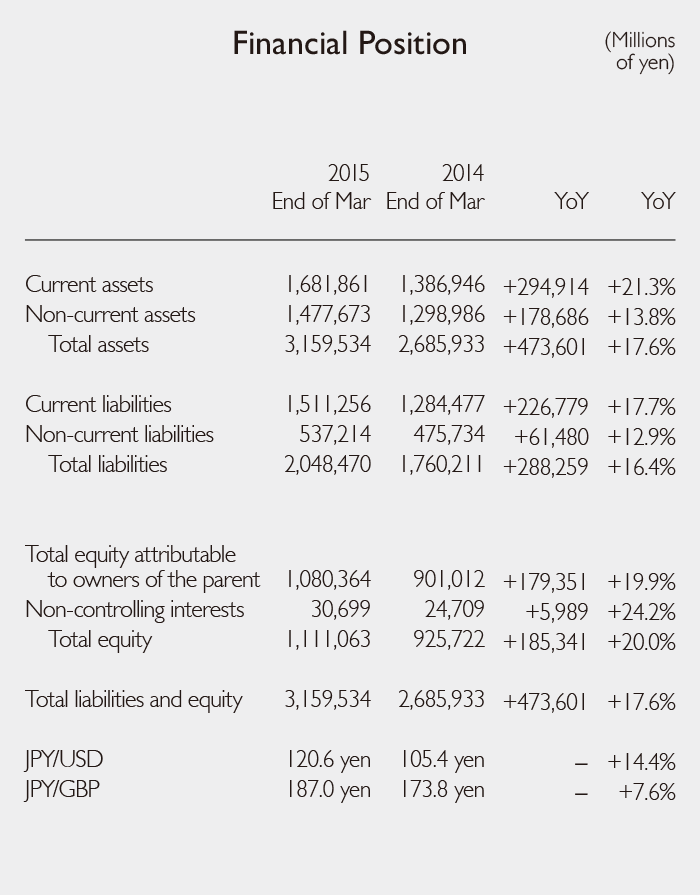
Current assets in the statement of financial position as of March 31, 2015, were 1,681.8 billion yen, up 21.3% from the end of the previous fiscal year. Factors behind the increase were a rise in trade receivables associated with growth in results, proceeds from sale of property, plant and equipment, intangible assets and investment property, and an increase in cash and cash equivalents associated with improvement in the turnover between receivables and payments. Non-current assets amounted to 1,477.6 billion yen, up 13.8%, reflecting valuation gains on the market value of investment securities held. As a result, total assets increased 17.6%, to 3,159.5 billion yen.
Meanwhile, current liabilities rose 17.7%, to 1,511.2 billion yen, due to an increase in trade payables. Non-current liabilities were up 12.9%, to 537.2 billion yen, primarily owing to an increase in borrowings at Dentsu Aegis Network.
As for equity, total equity attributable to owners of the parent increased 19.9%, to 1,080.3 billion yen, mainly due to an increase in unrealized gain on available-for-sale securities. Non-controlling interests were up 24.2%, to 30.6 billion yen.
Total debt stood at 409.6 billion yen as of March 31, 2015, but with 365.3 billion yen in cash and cash equivalents, net debt was 44.2 billion yen. Applying EBITDA of 174.5 billion yen, the net debt/EBITDA ratio was 0.25, and the net debt (LTM average)/EBITDA ratio was 0.69.
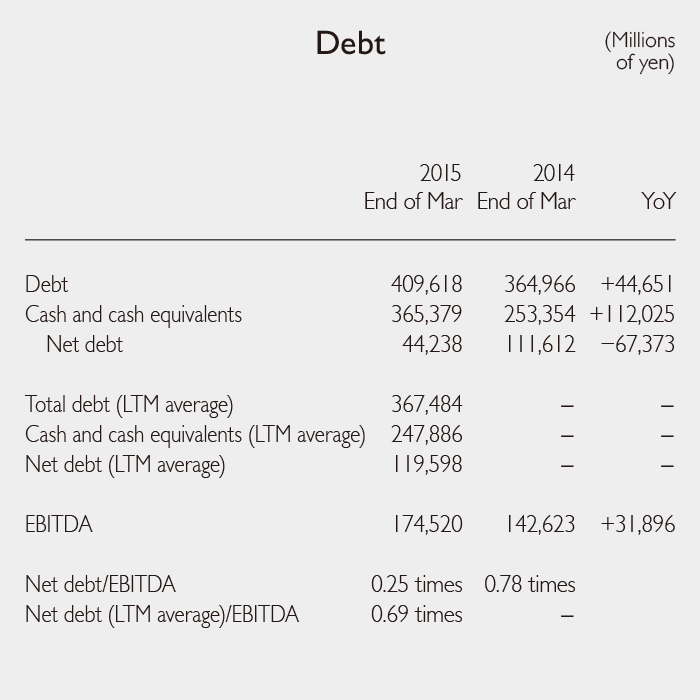
- Note:
- LTM = Last twelve months
Cash Flows
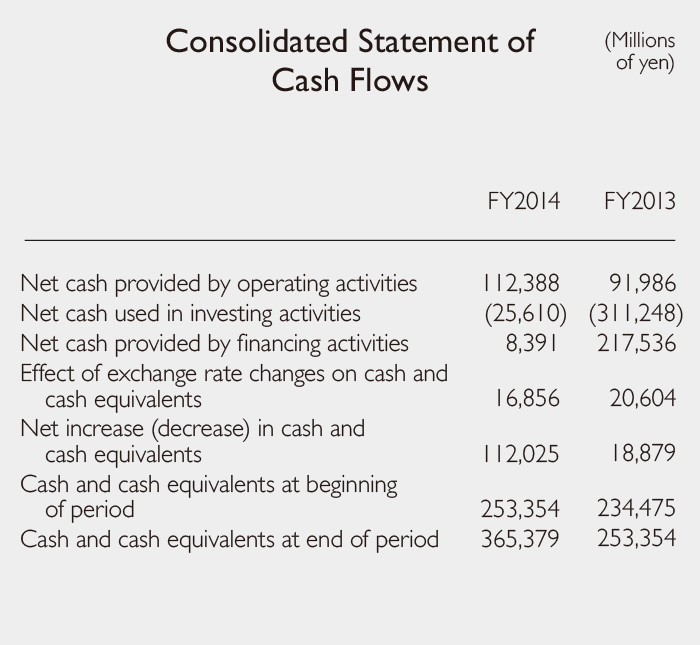
In fiscal 2014, net cash provided by operating activities amounted to 112.3 billion yen, an increase of 20.4 billion yen from the previous fiscal year, due mainly to an increase in profit before tax. Meanwhile, net cash used in investing activities amounted to 25.6 billion yen, owing mainly to 36.1 billion yen in M&A-related payments. This significant decrease of 285.6 billion yen was due to the absence of payments made in fiscal 2013 related to the acquisition of Aegis. Net cash provided by financing activities amounted to 8.3 billion yen, a decrease of 209.1 billion yen, due mainly to a decline in proceeds from long-term borrowings. As a result, cash and cash equivalents as of March 31, 2015 increased 112.0 billion yen from the end of the previous fiscal year, to 365.3 billion yen.
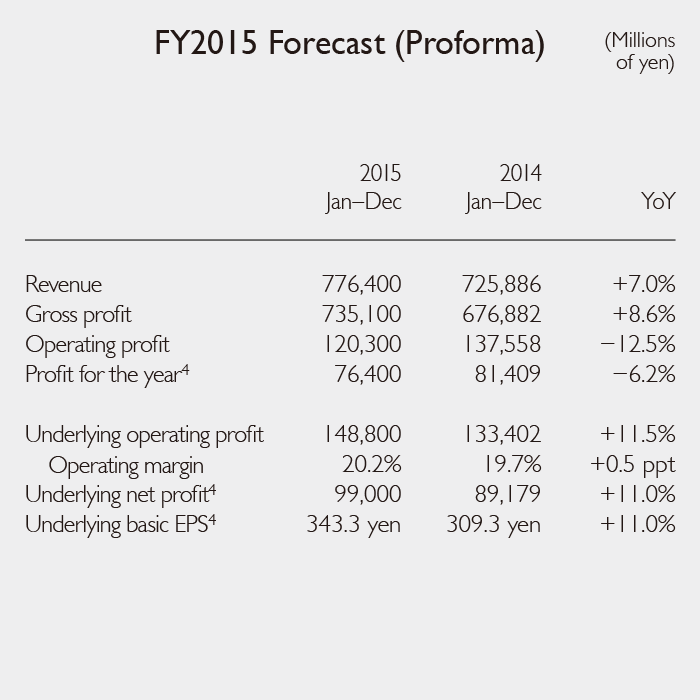
Fiscal 2015 Forecast (Proforma)
Dentsu Inc. and its subsidiaries with closing dates other than December 31 will change their closing dates to December 31 from fiscal 2015. Accordingly, fiscal 2015 will correspond to the fiscal period for the nine months from April 1, 2015 to December 31, 2015, based on an adjusted year-end.3
Therefore, the consolidated performance forecast for fiscal 2015 also shows the performance forecast on a proforma basis, which covers the period from January to December.
- 3
- For Dentsu Inc. and its subsidiaries with closing dates other than December 31, the fiscal year ending December 31, 2015 will correspond to the fiscal period for the nine months from April 1, 2015 to December 31, 2015, and for its subsidiaries with closing dates of December 31, the fiscal year ending December 31, 2015 will correspond to the fiscal period for the twelve months from January 1, 2015 to December 31, 2015, as before. Please see To Our Shareholders for the consolidated performance forecast for fiscal 2015 on a financial reporting basis.
- Note:
- FY2015 forecast uses the average exchange rate for the period January–February 2015; FY2014 actual uses the average exchange rate for the period January–December 2014.
- 4
- Profit for the year, Underlying net profit and Underlying basic EPS: Attributable to owners of the parent
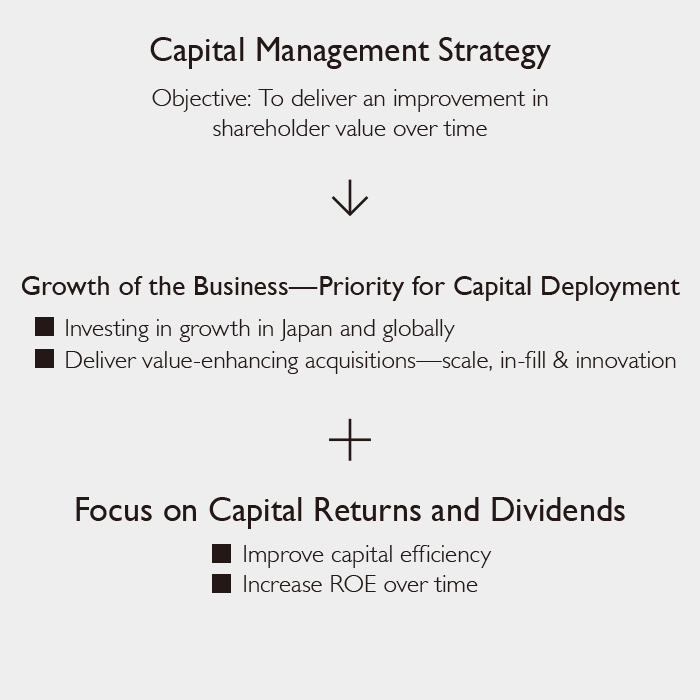
Capital Management Strategy and Return to Shareholders
The Dentsu Group’s capital management strategy is aimed at driving value for our shareholders. Investment in growth domains in Japan and globally is therefore our top priority, underpinned by the efficient deployment of capital, and we are pursuing sustainable profit growth centered on these domains. We will adhere to an acquisition strategy based on the following three fundamental guidelines: 1) scale (expanding local and regional coverage); 2) in-fill (adding to our portfolio of capabilities and geographies); and 3) innovation (acquiring cutting-edge capabilities). Furthermore, we will steadily improve return to shareholders by combining ongoing dividend payments and flexible share repurchases, as we strive to increase capital efficiency and improve our ROE in the medium term, in order to meet the expectations of our shareholders.
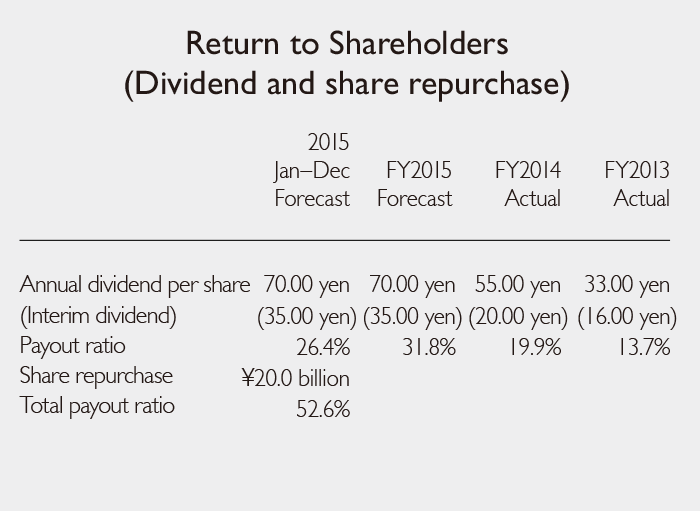
With regard to returning profits to shareholders, we raised the year-end dividend for fiscal 2014 from our initial forecast of 20 yen to 35 yen (an annual dividend of 55 yen including the interim dividend, compared with an annual dividend of 33 yen for the previous fiscal year). This resulted in a payout ratio of 19.9% (on an IFRS basis) for fiscal 2014. Also, we will pay an annual dividend of 70 yen for fiscal 2015 and have authorized a share repurchase up to a maximum value of 20.0 billion yen. Accordingly, we forecast a total payout ratio of 52.6% for fiscal 2015 on a calendar year proforma basis.
- Shoichi Nakamoto
Director
Senior Executive Vice President & CFO
![]()
