


- Consolidated
- Non-Consolidated
Millions of yen
except
per share data
| Dentsu Inc. and Consolidated Subsidiaries Years ended March 31 |
(JGAAP) |
(IFRS) |
|||
|---|---|---|---|---|---|
| 2013/3 | 2014/3 | 2015/3 | 2014/3 | 2015/3 | |
| For the year: | |||||
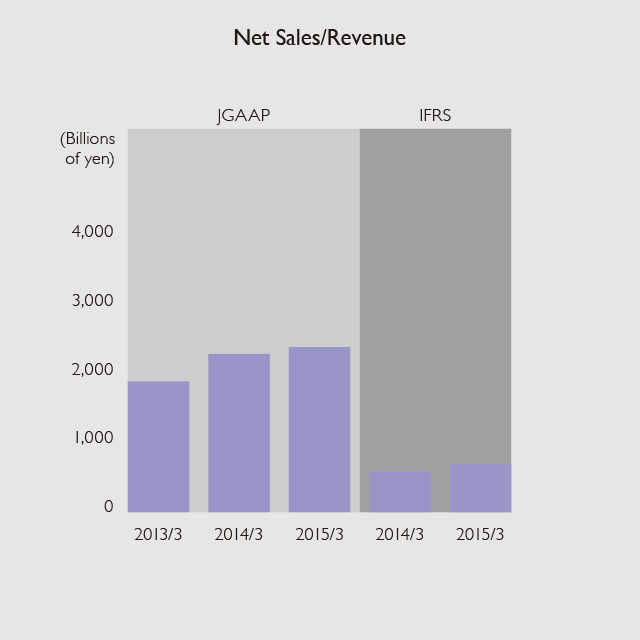
| Net sales/Revenue | 1,941,223 | 2,309,359 | 2,419,278 | 659,772 | 728,626 |
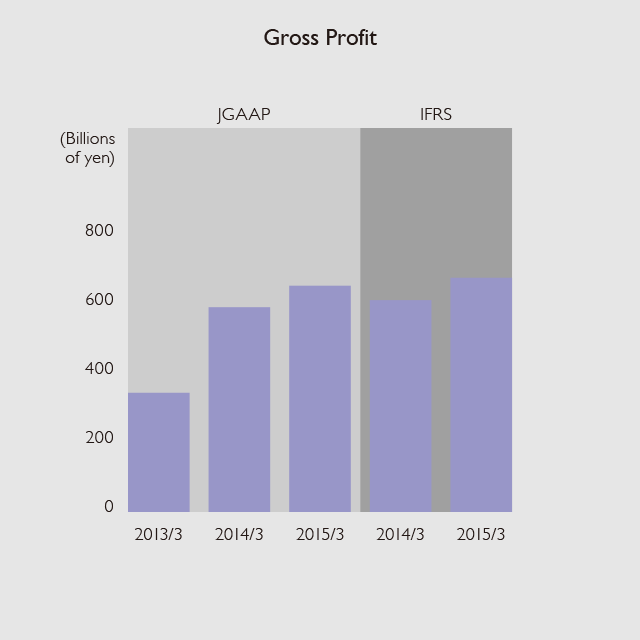
| Gross profit | 345,940 | 594,072 | 656,454 | 614,654 | 676,925 |
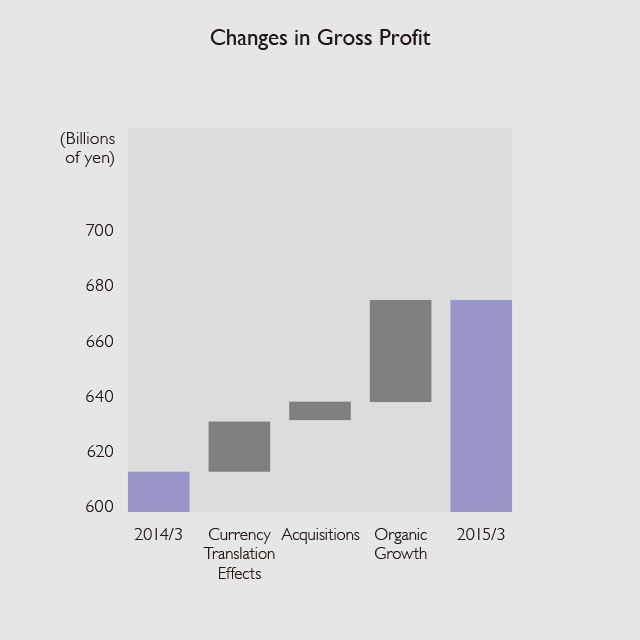
| Organic gross profit growth rate (%)(1) | - | 7.7 | 5.9 | - | 5.8 |
| Japan (%) | - | 9.2 | 1.9 | - | 2.2 |
| International (%) | - | 5.9 | 10.3 | - | 10.3 |
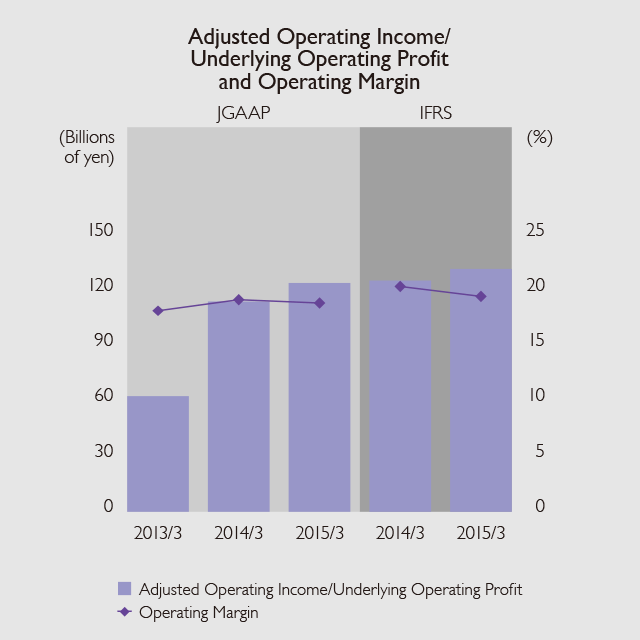
| Operating income/Operating profit | 58,466 | 71,490 | 72,695 | 107,283 | 132,305 |
| Ordinary income | 59,027 | 82,538 | 82,578 | - | - |
| Income before income taxes and minority interests/Profit before tax | 63,310 | 81,172 | 98,549 | 110,797 | 134,295 |
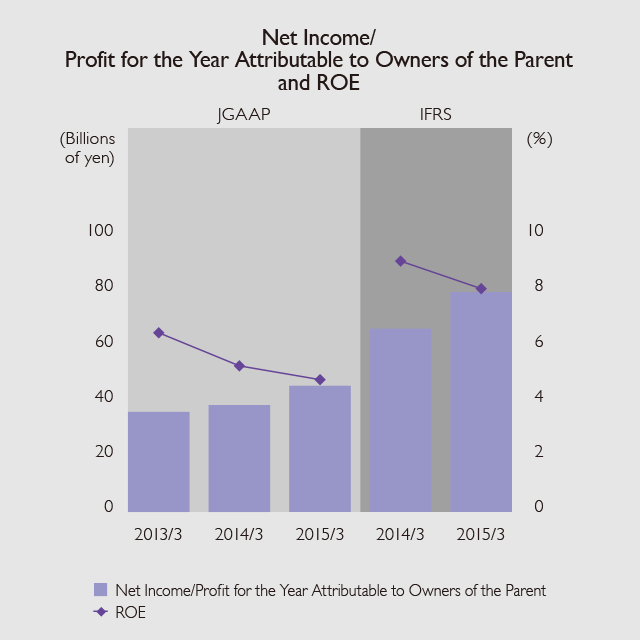
| Net income/Profit for the year attributable to owners of the parent | 36,336 | 38,800 | 45,818 | 66,507 | 79,846 |
| Underlying KPIs: | |||||
| Adjusted operating income(2)/Underlying operating profit(3) | 62,841 | 114,186 | 124,343 | 125,593 | 131,937 |
| Underlying net profit (attributable to owners of the parent)(4) | - | - | - | 84,395 | 92,875 |
| Net cash from operating activities | 83,295 | 97,540 | 114,751 | 91,986 | 112,388 |
| Net cash from investing activities | (51,236) | (318,087) | (28,494) | (311,248) | (25,610) |
| Net cash from financing activities | (5,349) | 226,526 | 12,197 | 217,536 | 8,391 |
| Cash and cash equivalents at end of period | 207,578 | 227,128 | 340,678 | 253,354 | 365,379 |
| At year-end: | |||||
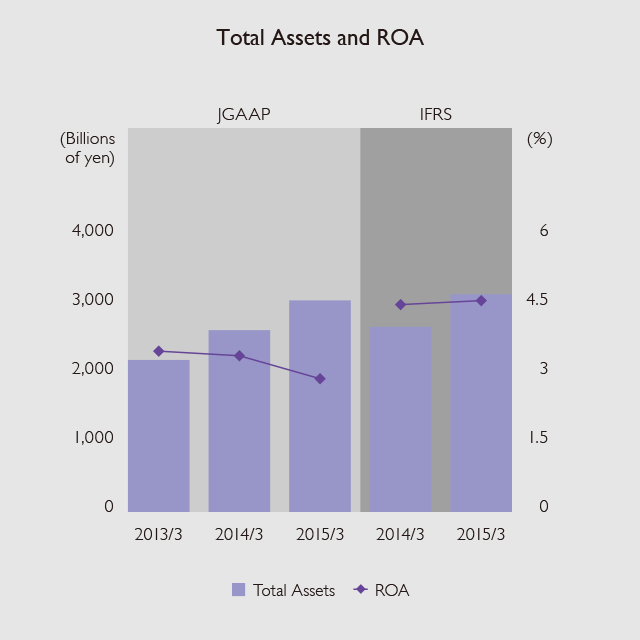
| Total assets | 2,205,569 | 2,638,319 | 3,075,028 | 2,685,933 | 3,159,534 |
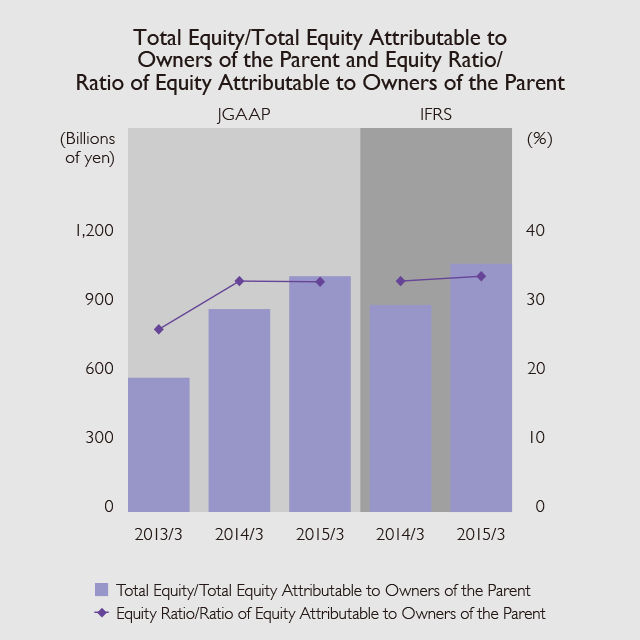
| Total equity/Total equity attributable to owners of the parent | 584,495 | 883,118 | 1,026,147 | 901,012 | 1,080,364 |
| Per share data (yen): | |||||
| Net income per share/Basic earnings per share | 145.84 | 140.89 | 158.89 | 241.49 | 276.89 |
| Underlying profit per share | - | - | - | 306.38 | 322.08 |
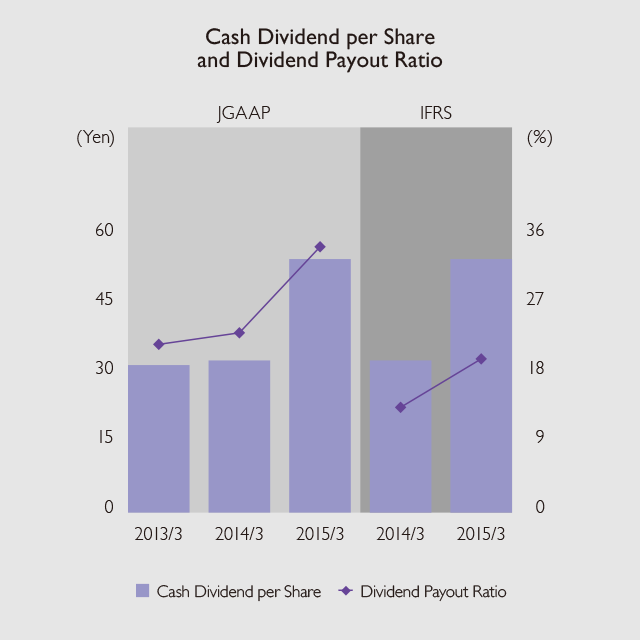
| Cash dividend per share | 32 | 33 | 55 | 33 | 55 |
| Ratios (%): | |||||
| Operating margin(5) | 18.2 | 19.2 | 18.9 | 20.4 | 19.5 |
| Japan | 19.0 | 23.3 | 24.2 | 23.6 | 23.9 |
| International | 13.8 | 14.6 | 14.0 | 16.7 | 15.3 |
| Return on equity(6)(7) (ROE) | 6.5 | 5.3 | 4.8 | 9.1 | 8.1 |
| Return on assets (ROA)(8)(9) | 3.5 | 3.4 | 2.9 | 4.5 | 4.6 |
| Equity ratio(10)/ Ratio of equity attributable to owners of the parent(11) |
26.5 |
33.5 |
33.4 |
33.5 |
34.2 |
| Dividend payout ratio(12) | 21.9 | 23.4 | 34.6 | 13.7 | 19.9 |
Dentsu has adopted International Financial Reporting Standards (IFRS) in place of Accounting Principles Generally Accepted in Japan (JGAAP) used to date for its consolidated financial statements, starting from the fiscal year ended March 31, 2015. In the table, certain line items differ depending on which reporting standards are applied and are shown separated by a slash (/). To the left of the slash is the line item used under JGAAP and to the right, that under IFRS.
- Notes:
-
- (1)
- Organic gross profit growth rate represents the constant currency year-on-year growth after adjusting for the effect of business acquired or disposed of since the beginning of the previous year.
- (2)
- Adjusted operating income (JGAAP): Operating profit before amortization of goodwill and M&A-related intangible assets
- (3)
- Underlying operating profit: KPI to measure recurring business performance which is calculated as operating profit added with amortization of M&A-related intangible assets, impairment loss, gain/loss on sales of non-current assets, acquisition costs and other one-off items
- (4)
- Underlying net profit (attributable to owners of the parent): KPI to measure recurring net profit attributable to owners of the parent which is calculated as net profit (attributable to owners of the parent) added with adjustment items related to operating profit, revaluation of earnout liabilities/M&A-related put-option liabilities, tax-related and NCI profit-related and other one-off items
- (5)
- Operating margin = Operating income before amortization of goodwill and other intangible assets or Underlying operating profit ÷ Gross profit × 100
- (6)
- ROE (JGAAP) = Net income ÷ Average equity based on equity at the beginning and end of the fiscal year × 100
- (7)
- ROE (IFRS) = Profit for the year attributable to owners of the parent ÷ Average equity attributable to owners of the parent based on equity at the beginning and end of the fiscal year × 100
- (8)
- ROA (JGAAP) = Ordinary income ÷ Average total assets based on total assets at the beginning and end of the fiscal year × 100
- (9)
- ROA (IFRS) = Profit before tax ÷ Average total assets based on total assets at the beginning and end of the fiscal year × 100
- (10)
- Equity ratio = Equity ÷ Total assets × 100
- (11)
- Ratio of equity attributable to owners of the parent = Equity attributable to owners of the parent ÷ Total assets
- (12)
- Dividend payout ratio = Cash dividend per share ÷ Net income per share or Basic earnings per share × 100
-
![Net Sales/Revenue]()
(Years ended March 31)
-
![Gross Profit]()
(Years ended March 31)
-
![Changes in Gross Profit]()
(Years ended March 31)
-
![Adjusted Operating Income/Underlying Operating Profit and Operating Margin]()
(Years ended March 31)
-
![Net Income/Profit for the Year Attributable to Owners of the Parent and ROE]()
(Years ended March 31)
-
![Total Assets and ROA]()
(Years ended March 31)
-
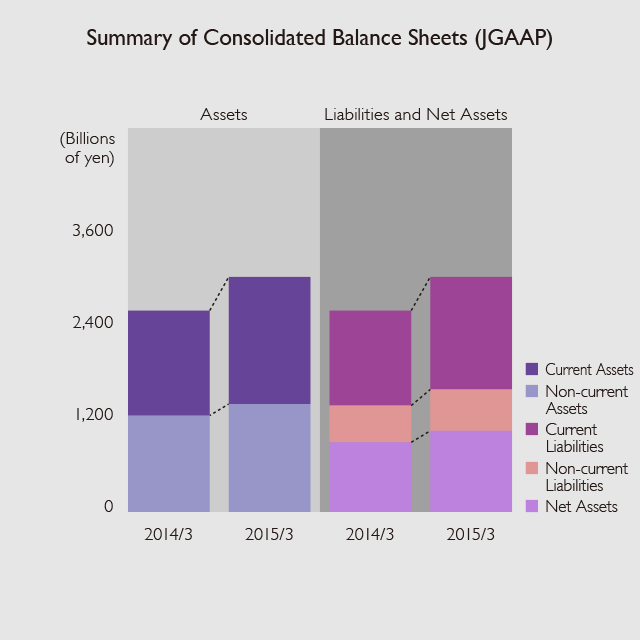
![Summary of Consolidated Balance Sheets (JGAAP)]()
(Years ended March 31)
-
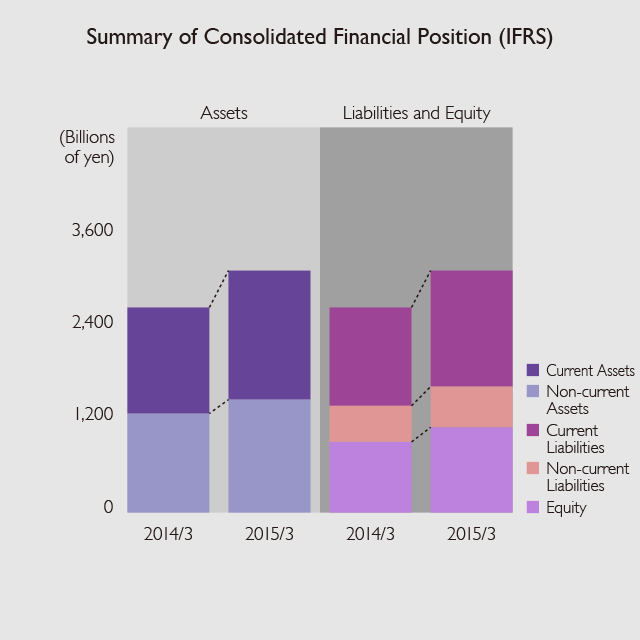
![Summary of Consolidated Financial Position (IFRS)]()
(Years ended March 31)
-
![Total Equity/Total Equity Attributable to Owners of the Parent and Equity Ratio/Ratio of Equity Attributable to Owners of the Parent]()
(Years ended March 31)
-
![Cash Dividend per Share and Dividend Payout Ratio]()
(Years ended March 31)


![]()
