Corporate Data
Financial data summary
Consolidated financial data
(Millions of yen)
| 20151 | 2016 | 2017 | 2018 | 2019 | 2020 | |
|---|---|---|---|---|---|---|
Profit and loss statement |
||||||
Turnover |
4,990,854 | 4,924,933 | 5,187,300 | 5,357,278 | 5,146,802 | 4,498,216 |
Revenue |
818,566 | 838,359 | 928,841 | 1,018,512 | 1,047,881 | 939,243 |
Revenue less cost of sales |
761,996 | 789,043 | 877,622 | 932,680 | 939,385 | 835,042 |
Operating profit (loss) |
128,212 | 137,681 | 137,392 | 111,638 | (3,358) |
(140,625) |
Profit (loss) before tax |
126,739 | 132,918 | 149,662 | 148,751 | (42,769) | (141,133) |
Profit (loss) for the year attributable to owners of the parent |
83,090 | 83,501 | 105,478 | 90,316 | (80,893) | (159,596) |
EBITDA |
175,454 | 184,064 | 194,073 | 171,406 | 160,280 | 90,063 |
Underlying operating profit2 |
160,438 | 166,565 | 163,946 | 153,229 | 140,751 | 123,979 |
Underlying net profit3 |
113,388 | 112,972 | 107,874 | 97,419 | 76,120 | 69,890 |
| Balance sheet | ||||||
Total assets |
3,066,075 | 3,155,230 | 3,562,857 | 3,638,488 | 3,795,729 | 3,380,412 |
Total equity attributable to owners of the parent |
1,068,216 | 932,742 | 1,093,211 | 1,047,619 | 974,977 | 756,870 |
| Cash flow | ||||||
| Net cash flow from operating activities | — | 143,585 | 141,557 | 133,049 | 79,957 | 88,313 |
| Net cash flow from investing activities | — | (156,161) | (85,531) |
(61,382) | (76,051) | 137,013 |
| Net cash flow from financing activities | — | 2,539 | 1,226 | 57,522 | (7,803) | (96,622) |
| Cash and cash equivalents at end of period | — | 242,410 | 305,760 | 416,668 | 414,055 | 530,692 |
| Number of employees | 47,324 | 55,843 | 60,064 | 62,608 | 66,400 | 64,533 |
| Number of consolidated subsidiaries | 760 | 844 | 911 | 976 | 1,004 | 1,007 |
- 1 2015 is reported on a pro forma basis.
- 2 Underlying operating profit: KPI to measure recurring business performance which is calculated as operating profit added with amortization of M&A related intangible assets, acquisition costs, share-based compensation expenses related to acquired companies and one-off items such as impairment loss and gain/loss on sales of non-current assets.
- 3 Underlying net profit (attributable to owners of the parent): KPI to measure recurring net profit attributable to owners of the parent which is calculated as net profit (attributable to owners of the parent) added with adjustment items related to operating profit, revaluation of earnout liabilities/M&A related put-option liabilities, gain/loss on sales of shares of associates, tax-related and NCI profit-related and other one-off items.
Note: The Group has adopted IFRS 15 “Revenue from Contracts with Customers” from the fiscal year ended December 31, 2018, and IFRS 16 “Leases” from the fiscal year ended December 31, 2019.
The figures for prior years are not restated and based on the former standards.
(%)
| 20151 | 2016 | 2017 | 2018 | 2019 | 2020 | |
|---|---|---|---|---|---|---|
Organic growth rate2 |
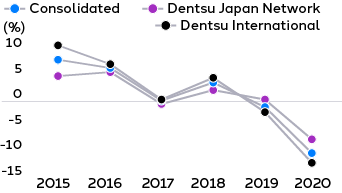
7.0 | 5.1 | 0.1 | 3.4 | (1.0) | (11.1) |
| Dentsu Japan Network | 3.9 | 4.5 | (0.3) | 2.1 | 0.4 | (8.4) |
| Dentsu International | 9.4 | 5.7 | 0.4 | 4.3 | (1.9) | (13.0) |
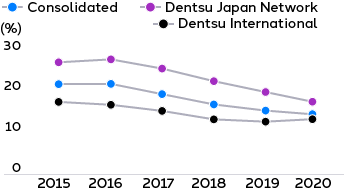
| Operating margin3 | 21.1 | 21.1 | 18.7 | 16.4 | 15.0 | 14.8 |
| Dentsu Japan Network | 26.0 | 26.8 | 24.5 | 21.7 | 19.1 | 18.0 |
| Dentsu International | 16.9 | 16.2 | 14.6 | 12.9 | 12.2 | 13.7 |
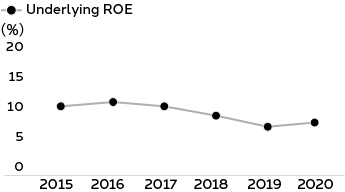
| Underlying ROE4 | 10.6 | 11.3 | 10.6 | 9.1 | 7.5 | 8.1 |
| Return on assets (ROA)5 | — | 4.3 | 4.5 | 4.1 | (1.2) | (3.9) |
| Ratio of equity attributable to owners of the parent (equity ratio)6 | 34.8 | 29.6 | 30.7 | 28.8 | 25.7 | 22.4 |
| Basic earnings per share (yen) | 289.95 | 292.85 | 373.11 | 320.39 | (287.92) | (571.19) |
| Basic underlying profit per share (yen) |
395.67 | 396.20 | 381.58 | 345.59 | 270.94 | 250.14 |
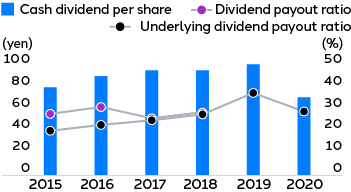
| Cash dividend per share (yen) | 75.00 | 85.00 | 90.00 | 90.00 | 95.00 | 71.25 |
| Dividend payout ratio7 | 25.9 | 29.0 | 24.1 | 28.1 | — | — |
| Underlying dividend payout ratio8 | 19.0 | 21.5 | 23.6 | 26.0 | 35.1 | 28.5 |
- 1 2015 is reported on a pro forma basis.
- 2 Organic growth rate represents the constant currency year-on-year growth after adjusting for the effect of business acquired or disposed of since the beginning of the previous year.
- 3 Operating margin = Underlying operating profit ÷ Revenue less cost of sales x 100
- 4 Underlying ROE = Underlying net profit (attributable to owners of the parent) ÷ Average equity attributable to owners of the parent based on equity at the beginning and end of the fiscal year x 100
(Fiscal year-end before alignment across the Group means March) - 5 ROA (IFRS) = Profit before tax ÷ Average total assets based on total assets at the beginning and end of the fiscal year x 100
- 6 Ratio of equity attributable to owners of the parent = Equity attributable to owners of the parent ÷ Total assets
- 7 Dividend payout ratio = Cash dividend per share ÷ Basic earnings per share x 100
- 8 Underlying dividend payout ratio = Cash dividend per share ÷ Basic underlying profit per share x 100