Financial Data Summary
Consolidated financial data
(Millions of yen)
| 20151 | 2016 | 2017 | 2018 | 2019 | 2020 | 2021 | |
|---|---|---|---|---|---|---|---|
Profit and loss statement |
|||||||
Turnover |
4,990,854 | 4,924,933 | 5,187,300 | 5,357,278 | 5,146,802 | 4,498,216 | 5,256,492 |
Revenue |
818,566 | 838,359 | 928,841 | 1,018,512 | 1,047,881 | 939,243 | 1,085,592 |
Net revenue |
761,996 | 789,043 | 877,622 | 932,680 | 939,385 | 835,042 | 976,577 |
Operating profit (loss) |
128,212 | 137,681 | 137,392 | 111,638 | (3,358) | (140,625) | 241,841 |
Profit (loss) before tax |
126,739 | 132,918 | 149,662 | 148,751 | (42,769) | (141,133) | 208,833 |
Profit (loss) for the year attributable to owners of the parent |
83,090 | 83,501 | 105,478 | 90,316 | (80,893) | (159,596) | 108,389 |
Underlying EBITDA2 |
— | — | — | — | — | 145,335 | 195,006 |
Underlying operating profit3 |
160,438 | 166,565 | 163,946 | 153,229 | 140,751 | 123,979 | 179,028 |
Underlying net profit4 |
113,388 | 112,972 | 107,874 | 97,419 | 76,120 | 69,890 | 109,203 |
| Balance sheet | |||||||
Total assets |
3,066,075 | 3,155,230 | 3,562,857 | 3,638,488 | 3,795,729 | 3,380,412 | 3,720,536 |
Total equity attributable to owners of the parent |
1,068,216 | 932,742 | 1,093,211 | 1,047,619 | 974,977 | 756,870 | 845,034 |
| Cash flow | |||||||
Net cash flow from operating activities |
— | 143,585 | 141,557 | 133,049 | 79,957 | 88,313 | 139,715 |
Net cash flow from investing activities |
— | (156,161) | (85,531) | (61,382) | (76,051) | 137,013 | 262,226 |
Net cash flow from financing activities |
— | 2,539 | 1,226 | 57,522 | (7,803) | (96,622) | (232,189) |
Cash and cash equivalents at end of period |
— | 242,410 | 305,760 | 416,668 | 414,055 | 530,692 | 723,541 |
Number of employees |
47,324 | 55,843 | 60,064 | 62,608 | 66,400 | 64,533 | 64,832 |
Number of consolidated subsidiaries |
760 | 844 | 911 | 976 | 1,004 | 1,007 | 907 |
- 1 2015 is reported on a pro forma basis.
- 2 Underlying EBITDA: Underlying operating profit before depreciation and amortization (excluding depreciation adjustments under IFRS 16).
- 3 Underlying Operating Profit: KPI calculated by eliminating M&A related items and one-off items from operating profit, and is used by management for the purpose of measuring constant business performance.
M&A related items: amortization of intangible assets incurred in acquisitions, acquisition costs, share-based compensation expenses attributable to the acquiree, share-based compensation expense issued following the acquisition of 100% ownership of a subsidiary
One-off items: items such as restructuring costs, impairment loss and gain/loss on sales of non-current assets - 4 Underlying net profit (attributable to owners of the parent): KPI to measure recurring net profit attributable to owners of the parent which is calculated as net profit (attributable to owners of the parent) added with adjustment items related to operating profit, revaluation of earnout liabilities/M&A related put-option liabilities, gain/loss on sales of shares of associates, tax-related and NCI profit-related and other one-off items.
Note: The Group has adopted IFRS 15 “Revenue from Contracts with Customers” from the fiscal year ended December 31, 2018, and IFRS 16 “Leases” from the fiscal year ended December 31, 2019. The figures for prior years are not restated and based on the former standards.
Note: The Group has traditionally recognized configuration or customization costs in cloud computing contracts as intangible assets by applying IAS 38 “Intangible Assets.” However, based on the discussions that led to the agenda decision by the IFRS Interpretations Committee announced in April 2021, the method has been changed so as to recognize the costs of receiving configuration or customization services as expenses. However, in this report, figures prior to the fiscal year ended December 31, 2020 are presented as before the change in accounting policy. Thus, figures from the fiscal year ended December 31, 2020 differ from figures in the Summary of Financial Results for the Fiscal Year Ended December 31, 2021 where the presentation was retrospectively restated.
(%)
| 20151 | 2016 | 2017 | 2018 | 2019 | 2020 | 2021 | ||
|---|---|---|---|---|---|---|---|---|
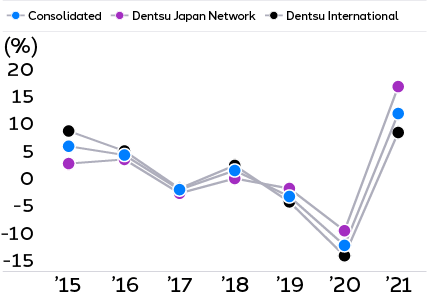
Organic growth rate2 |
7.0 | 5.1 | 0.1 | 3.4 | (1.0) | (11.1) | 13.1 | |
| Dentsu Japan Network | 3.9 | 4.5 | (0.3) | 2.1 | 0.4 | (8.4) | 17.9 | |
| Dentsu International | 9.4 | 5.7 | 0.4 | 4.3 | (1.9) | (13.0) | 9.7 | |
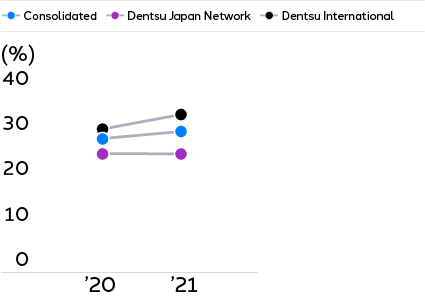
CT&T3 ratio |
— | — | — | — | — | 27.5 | 29.1 | |
| Dentsu Japan Network | — | — | — | — | — | 24.5 | 24.4 | |
| Dentsu International | — | — | — | — | — | 29.7 | 32.6 | |
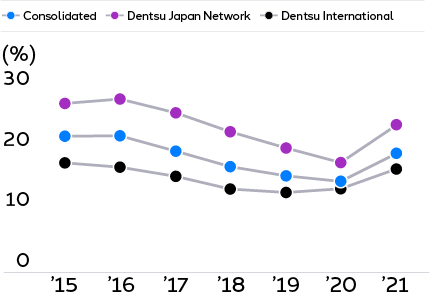
Operating margin4 |
21.1 | 21.1 | 18.7 | 16.4 | 15.0 | 14.8 | 18.3 | |
| Dentsu Japan Network | 26.0 | 26.8 | 24.5 | 21.7 | 19.1 | 18.0 | 22.9 | |
| Dentsu International | 16.9 | 16.2 | 14.6 | 12.9 | 12.2 | 13.7 | 15.9 | |
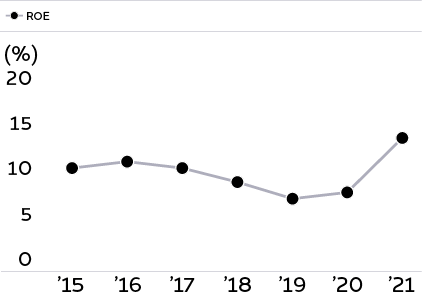
Underlying ROE5 |
10.6 | 11.3 | 10.6 | 9.1 | 7.5 | 8.1 | 13.8 | |
Return on assets (ROA)6 |
— | 4.3 | 4.5 | 4.1 | (1.2) | (3.9) | 5.9 | |
Ratio of equity attributable to owners of the parent (equity ratio) 7 |
34.8 | 29.6 | 30.7 | 28.8 | 25.7 | 22.4 | 22.7 | |
Basic earnings per share (yen) |
289.95 | 292.85 | 373.11 | 320.39 | (287.92) | (571.19) | 388.79 | |
Basic underlying profit per share (yen) |
395.67 | 396.20 | 381.58 | 345.59 | 270.94 | 250.14 | 391.71 | |
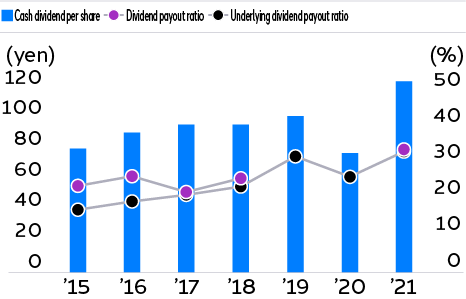
Cash dividend per share (yen) |
75.00 | 85.00 | 90.00 | 90.00 | 95.00 | 71.25 | 117.50 | |
Dividend payout ratio8 |
25.9 | 29.0 | 24.1 | 28.1 | — | — | 30.2 | |
Underlying dividend payout ratio9 |
19.0 | 21.5 | 23.6 | 26.0 | 35.1 | 28.5 | 30.0 | |
- 1 2015 is reported on a pro forma basis.
- 2 Organic growth rate represents the constant currency year-on-year growth after adjusting for the effect of business acquired or disposed of since the beginning of the previous year.
- 3 CT&T (Customer Transformation & Technology): high growth business domain including the services related to marketing technology, customer experience management, commerce, system integration, and transformation & growth strategy.
- 4 Operating margin = Underlying operating profit ÷ Net revenue x 100
- 5 Underlying ROE = Underlying net profit (attributable to owners of the parent) ÷ Average equity attributable to owners of the parent based on equity at the beginning and end of the fiscal year x 100
(Fiscal year-end before alignment across the Group means March) - 6 ROA (IFRS) = Profit before tax ÷ Average total assets based on total assets at the beginning and end of the fiscal year x 100
- 7 Ratio of equity attributable to owners of the parent = Equity attributable to owners of the parent ÷ Total assets
- 8 Dividend payout ratio = Cash dividend per share ÷ Basic earnings per share x 100
- 9 Underlying dividend payout ratio = Cash dividend per share ÷ Basic underlying profit per share x 100
Underlying dividend payout ratio