ESG Data Summary
Dentsu Group Inc.
Governance data
| 2016 | 2017 | 2018 | 2019 | 2020 | 2021 | |
|---|---|---|---|---|---|---|
Directors |
12 | 12 | 12 | 12 | 12 | 13 |
Outside Directors |
3(3) | 4(4) | 4(4) | 4(4) | 5(4) | 5(5) |
Ratio of independent Outside Directors (%) |
25.0 | 33.3 | 33.3 | 33.3 | 33.3 | 38.5 |
Female Directors |
1 | 2 | 2 | 2 | 2 | 3 |
Ratio of female Directors (%) |
8.3 | 16.7 | 16.7 | 16.7 | 16.7 | 23.1 |
Board of Director meeting attendance rate (%) |
95.4 | 96.9 | 98.0 | 96.9 | 95.6* | 99.1 |
Attendance rate of independent |
96.1 | 96.3 | 98.5 | 93.8 | 100.0 | 98.8 |
- * Attendance rate was 97.8% excluding times when Tim Andree was absent due to illness.
Consolidated data
Social data
Number of employees
| December 2017 | December 2018 | December 2019 | December 2020 | December 2021 | |
|---|---|---|---|---|---|
Total |
60,064 | 62,608 | 66,400 | 64,533 | 64,832 |
Employees and Managers
As of December 2021
| Total | Male | Female | Female(%) | ||
|---|---|---|---|---|---|
Employees |
64,832 | 33,815 | 31,017 | 47.8 | |
| Dentsu Group Inc. | 195 | 147 | 48 | 24.6 | |
| Dentsu Japan Network | 19,867 | 12,822 | 7,045 | 35.5 | |
| Dentsu International | 44,770 | 20,846 | 23,924 | 53.4 | |
| Managers | 4,939 | 4,126 | 807 | 16.3 | |
| Dentsu Group Inc. | 42 | 33 | 9 | 21.4 | |
| Dentsu Japan Network | 4,098 | 3,572 | 526 | 12.8 | |
| Dentsu International | 799 | 521 | 272 | 34.0 | |
- Note: Dentsu International (DI) managerial position totals and female ratio calculations include six people who did not
disclose their gender.
Community activities
As of December 2021
| Total | Dentsu Japan Network | Dentsu International | |
|---|---|---|---|
| Donations (yen) | 1,822,728,018 | 1,267,443,980 | 555,284,038* |
| Participants in volunteer activities | 3,624 | 542 | 3,082 |
| Hours spent participating in volunteer activities | 32,704 | 11,608 | 21,096 |
- * Exchange rate: £1=¥151.1
Environmental performance data
| 2018 | 2019 | 2020 | 2021 | ||
|---|---|---|---|---|---|
Scope 1 |
4,981 | 4,888 | 3,540 | 3,195 | |
| Dentsu Japan Network | 426 | 344 | 355 | 310 | |
| Dentsu International | 4,555 | 4,544 | 3,185 | 2,885 | |
Scope 2 |
39,130 | 29,074 | 23,415 | 20,908 | |
| Dentsu Japan Network | 26,513 | 24,202 | 20,872 | 19,343 | |
| Dentsu International | 12,617 | 4,872 | 2,543 | 1,565 | |
Scope 1+2 |
44,111 | 33,962 | 26,955 | 24,103 | |
| Dentsu Japan Network | 26,939 | 24,546 | 21,227 | 19,653 | |
| Dentsu International | 17,172 | 9,416 | 5,728 | 4,450 | |
Scope 3 |
69,680 | 374,884 | 55,374 | 360,324 | |
| Category 1 | 2,087 | 265,960 | 25,615 | 316,082 | |
| Dentsu Japan Network | 1,311 | 28,773 | 25,202 | 24,284 | |
| Dentsu International | 776 | 237,187 | 413 | 291,798 | |
| Category 3 | N/A | 8,813 | 5,481 | 10,779 | |
| Dentsu Japan Network | N/A | 6,500 | 5,481 | 5,155 | |
| Dentsu International | N/A | 2,313 | N/A | 5,624 | |
| Category 4 | N/A | 288 | 1,856 | 3,558 | |
| Dentsu Japan Network | N/A | 0 | 1,856 | 2,978 | |
| Dentsu International | N/A | 288 | N/A | 580 | |
| Category 5 | 1,627 | 1,246 | 1,098 | 1,207 | |
| Dentsu Japan Network | 152 | 424 | 596 | 931 | |
| Dentsu International | 1,475 | 822 | 502 | 276 | |
| Category 6 | 62,253 | 79,417 | 16,370 | 9,909 | |
| Dentsu Japan Network | 11,631 | 25,406 | 4,973 | 3,055 | |
| Dentsu International | 50,622 | 54,011 | 11,397 | 6,854 | |
| Category 7 | 3,713 | 13,660 | 4,954 | 14,668 | |
| Dentsu Japan Network | 3,713 | 5,049 | 4,954 | 2,350 | |
| Dentsu International | N/A | 8,611 | N/A | 12,318 | |
| Category 13 | N/A | 3,469 | N/A | 331 | |
| Dentsu International | N/A | 3,469 | N/A | 331 | |
| Category 15 | N/A | 2,031 | N/A | 3,790 | |
| Dentsu International | N/A | 2,031 | N/A | 3,790 | |
| CO2 emissions (Scope 1 + 2 + 3) | 113,791 | 408,846 | 82,329 | 384,427 | |
| 2018 | 2019 | 2020 | 2021 | ||
|---|---|---|---|---|---|
Amount of waste (kg) |
7,884,635 | 6,456,545 | 5,270,342 | 4,469,072 | |
| Dentsu Japan Network* | 3,747,229 | 3,246,545 | 2,706,342 | 2,893,072 | |
| Dentsu International | 4,137,406 | 3,210,000 | 2,564,000 | 1,576,000 | |
| Waste recycling rate (Dentsu Inc. only) | 88.1 | 85.7 | 86.2 | 89.6 | |
| Water consumption (m³) | 806,030 | 776,321 | 497,525 | 367,482 | |
| Dentsu Japan Network | 273,394 | 315,808 | 213,321 | 164,712 | |
| Dentsu International | 532,636 | 460,513 | 284,204 | 202,770 | |
- * The figures for Dentsu Japan Network (DJN) include its own buildings (Ginza Building, Fukuoka Building, Kousan 1 Building,
Kousan 3 Building, and Sapporo Building).
Scope and Method of Calculation
- Excluding some Dentsu Group companies
- Calculation based on GHG protocol
- Regarding Scope 1 and 2 emissions, for owned buildings, all equity usage is recorded, including tenant usage
- Within CO2 emissions, Scope 3 is calculated for all categories (1–15), and values for applicable item categories 1, 3, 4, 5, 6, 7, 13 and 15 are listed. (Items that do not apply are not listed)
From FY2021, the calculation range was expanded (category 1, 3, 4, 13 and 15), accordingly, figures from 2019 (both DJN and DI), the base year of the Medium-term Management Plan, and 2020 figures (DJN) were revised retroactively (LRQA verification is not complete for DJN’s 2019 and 2020 retroactive calculations) - The volume of waste generated (in kg) is the sum of general waste and industrial waste (including waste oil, waste plastic)
- The volume of water resources used is the sum of municipal water and gray water at the Tokyo Head Office, and the municipal water used at the Kansai Branch Office and Chubu Branch Office
Third-party assurance
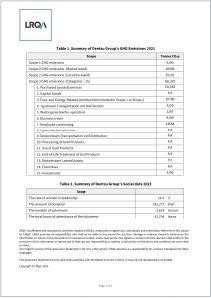
The rate of women in leadership, the amount of donations, the number of participants in volunteer activities, the hours spent participating in volunteer activities, and CO2 emissions (greenhouse gas emissions) from Dentsu Group are verified, and certification is provided (left), by Lloyd’s Register Quality Assurance Ltd (LRQA).
Total electricity consumption, amount of renewable energy use, and renewable
energy usage rate*
| 2021 | Total electricity consumption (kWh) |
Amount of renewable energy use (kWh) |
Renewable energy usage rate |
|---|---|---|---|
| Dentsu Group (total) | 71,751,938 | 35,868,409 | 50.0% |
- * Calculation based on GHG protocol
Dentsu Inc.
Personnel data
Number of employees
| December 2017 | December 2018 | December 2019 | December 2020 | December 2021 | |
|---|---|---|---|---|---|
Total |
6,927 | 6,921 | 7,071 | 6,907 | 6,578 |
New graduates hired
| April 2018 | April 2019 | April 2020 | April 2021 | April 2022 | |
|---|---|---|---|---|---|
Total |
145 | 141 | 122 | 115 | 97 |
| Male | 84 | 73 | 66 | 63 | 52 |
| Female | 61 | 68 | 56 | 52 | 45 |
| Female component (%) | 42.1 | 48.2 | 45.9 | 45.2 | 46.4 |
Career recruitment
(by job position, full-year, permanent employee assignment)
| 2017 | 2018 | 2019 | 2020 | 2021 | |
|---|---|---|---|---|---|
Total |
99 | 95 | 68 | 24 | 44 |
| Male | 76 | 74 | 50 | 18 | 25 |
| Female | 23 | 21 | 18 | 6 | 19 |
| Female component (%) | 23.2 | 22.1 | 26.5 | 25.0 | 43.2 |
Employee composition1
| As of December 2021 | ||||
|---|---|---|---|---|
| Male | Female | Total | Ratio (%) | |
Executive Officers, others2 |
32 | 2 | 34 | 0.5 |
| Managers | 1,445 | 166 | 1,611 | 24.5 |
| Non-managers | 2,169 | 1,066 | 3,235 | 49.2 |
| Contract employees | 263 | 336 | 599 | 9.1 |
| Clerical staff | 0 | 468 | 468 | 7.1 |
| Partners / senior staff | 253 | 61 | 314 | 4.8 |
| Part-timers, others3 | 25 | 25 | 50 | 0.8 |
| Seconded from other entities | 165 | 102 | 267 | 4.1 |
| Total | 4,352 | 2,226 | 6,578 | 100.0 |
- 1 Employees on temporary assignments are excluded.
- 2 Includes Senior Corporate Advisors, Special Advisors, and Executive Officers
(excluding Directors and Corporate Auditors). - 3 Indicates permanent part-timers, nonpermanent part-timers, and employees of overseas branches.
Average age of employees*
| Total | 41.5 |
|---|---|
Male |
43.5 |
| Female | 37.5 |
- * Full-time employees only
Average number of consecutive years served*
| Total | 14.5 |
|---|---|
Male |
17.0 |
| Female | 9.6 |
- * Full-time employees only
Number of employees by age bracket*
| Age | Number of people | Ratio (%) |
|---|---|---|
| Under 30 | 1,006 | 15.3 |
| 30–39 | 2,071 | 31.5 |
| 40–49 | 1,818 | 27.6 |
| 50–59 | 1,338 | 20.3 |
| Over 60 | 345 | 5.2 |
| Total | 6,578 | 100.0 |
- * Includes staff from other companies assigned to Dentsu Inc.; excludes staff from Dentsu Inc. dispatched to other companies.
Work–life balance
Average number of paid vacation days taken
| Average days used | Paid holidays | Usage rate (%) | |
|---|---|---|---|
| Male | 12.4 | 20 | 62.0 |
| Female | 13.4 | 20 | 67.0 |
Total |
12.7 | 20 | 63.5 |
Number of employees utilizing childcare leave, usage rate, ratio of employees who return to work
| Number of users | Number of eligible employees | Usage rate (%) | Ratio of employees who return to work (%) | |
|---|---|---|---|---|
| Male | 155 | 217 | 71.4 | 100 |
| Female | 50 | 50 | 100.0 | 100 |
Total hours worked per year*
| 2012 | 2013 | 2014 | 2015 | 2016 | 2017 | 2018 | 2019 | 2020 | 2021 | |
|---|---|---|---|---|---|---|---|---|---|---|
Total |
2,251 | 2,265 | 2,252 | 2,187 | 2,166 | 2,032 | 1,952 | 1,903 | 1,838 | 2,023 |
- * In accordance with working time management changes, since FY2017, the figures for actual time worked have been adopted to calculate total time worked. Management staff are included in these figures.
Talent development
Investment per employee (yen)
| Investment | 96,748 |
|---|
Time for training per employee (hour)
| Time for training | 33.0 |
|---|
Leveraging diverse human resources
Employment rate of people with disabilities (%)*
| June 2018 | June 2019 | June 2020 | June 2021 | June 2022 | |
|---|---|---|---|---|---|
Total |
2.14 | 2.35 | 2.38 | 2.73 | 3.13 |
- * Total of four companies under the special subsidiary system (Dentsu Group Inc., Dentsu Solari Inc., Dentsu Inc., and Dentsu Corporate One Inc.), until 2019, three companies combined (Dentsu Inc., Dentsu Solari Inc., and Dentsu Works Inc.)
Number of post-retirement rehires
| 2017 | 2018 | 2019 | 2020 | 2021 | |
|---|---|---|---|---|---|
Total |
51 | 58 | 67 | 96 | 101 |
| Male | 41 | 53 | 55 | 79 | 80 |
| Female | 10 | 5 | 12 | 17 | 21 |
Global engagement survey
Engagement score (point)*
| Engagement score | 68 |
|---|---|
| Employee satisfaction | 68 |
| Recommend | 67 |
- * The employee satisfaction and the recommend scores are the average scores of the respondents (five-step grades between 0-100). The engagement score is the average of the employee satisfaction and the recommend.
Dentsu Japan Network
New graduates hired
| April 2022 | |
|---|---|
Total |
446 |
| Male | 238 |
| Female | 208 |
| Female component (%) | 46.6 |
Usage rate of vacation days (%)
Total |
50.4 |
|---|
Total hours worked per year
| 2021 | |
|---|---|
Total |
2,000 |
Number of employees utilizing childcare leave, number of eligible employees, usage rate
| Number of users | Number of eligible employees | Usage rate (%) | |
|---|---|---|---|
| Male | 205 | 465 | 44.1 |
Internal reporting: Compliance Line reports (cases)*
| 2017 | 2018 |
2019 | 2020 | 2021 | |
|---|---|---|---|---|---|
| Total | 9 | 24 | 17 | 10 | 6 |
- * Main report content topics include internal harassment, improper treatment, fraud in business operations and misgivings about Company systems.
Number of internal reported complaints (cases)*
| 2017 | 2018 |
2019 | 2020 | 2021 | |
|---|---|---|---|---|---|
| Total | 146 | 183 | 194 | 106 | 136 |
- * In 2021, previous fiscal year figures were recounted.
Dentsu International
Internal reporting: number of “Speak Up!” incident reports (cases)
| 2017 | 2018 |
2019 | 2020 | 2021 | |
|---|---|---|---|---|---|
| Total | 12 | 44 | 35 | 43 | 38 |
Average age of employees
As of December 2021
| Total | 33.1 |
|---|
Average number of consecutive years served
As of December 2021
| Total | 3.5 |
|---|
Employees by age (%)
As of December 2021
| Under 30 years of age | 38.9 |
|---|---|
| 30–39 years of age | 37.7 |
| 40–49 years of age | 16.3 |
| 50–59 years of age | 6.0 |
| Over 60 years of age | 1.1 |
Ratio of employees by years of service (%)
As of December 2021
| Less than one year | 37.1 |
|---|---|
| One to three years | 22.7 |
| Three to five years | 14.7 |
| Five or more years | 25.5 |