Message
Message from Chief Financial Officer
Value and Profit for the Medium to Long term
In August 2018, the Dentsu Group announced mediumterm financial guidance based on three metrics that would carry us through to the end of FY2020 (ending December 31, 2020).
The first metric is organic growth of revenue less cost of
sales, which shows how much our business has grown, namely, the degree to which customers depend on us. Business acquired through M&A activity aside, we aim to achieve a three-year compound annual growth rate of 3% or more during the three
years leading up to FY2020.
The second metric is our operating margin. This shows the degree of added value we provide for customers, and our business efficiency. As long as customers value our solutions, the operating margin should
rise. Further, since efficient business management boosts the operating margin, it should be higher than in FY2018 by FY 2020.
The third metric concerns steady shareholder returns, to ensure that our operating performance and cash flow
enable shareholders to profit. To this end, each year we will maintain or increase the dividend per share and consider buying back shares, as we reflect regular comprehensive reviews of our assets and capital requirements.
We are currently in the process of restructuring our business on the basis of the above metrics. Phase 1 was completed during 2017–18 with the setting up of new business foundations. Phase 2 will cover FY2019–20, and will see us carry out Group-wide business reforms.
Phase 1: Foundations FY2017–18
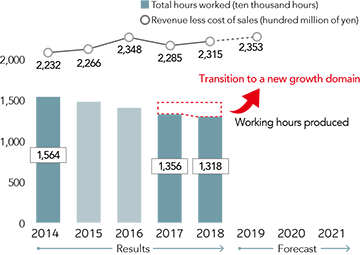
Total hours worked by employees andgross profit
(Parent Company only)
In 2017, both the domestic and international businesses of Dentsu Group began a period of internal investment.
This required that we transformed ourselves to reflect the accelerated transformation of society through digitalization. To
give a software analogy, the Operating System we were using to conduct business needed to be updated.
Japan Business
We began the working environment reforms in 2017 and, by the end of FY2018, had invested ¥18.3 billion in the restructuring. Using the total number of hours worked by employees as a key performance indicator, we cut staff working hours at the Parent Company by carrying out the following measures:
- Increasing staff numbers to reduce workload.
- Streamlining operations, and eliminating, automating, and outsourcing as much as possible.
- Upgrading our office environments to reflect the era of progressive digitalization.
These steps reduced the hours worked by employees at the Parent Company. At the same time, they allowed us to attain our highest revenue less cost of sales levels ever, and two of our targets: reduced working hours and improved efficiency of our operations.
International Business
We also faced operational challenges in the International business as well. Since acquiring Aegis in 2013, our international business has grown some threefold, and we have conducted more than 150 acquisitions. As a result, we encountered functional overlap—primarily in our middle office, where inefficiency was caused by the simultaneous use of a number of different systems.
These issues were resolved as we adopted shared, global platforms, systems, and services during phase 1 restructuring.
The investments have led to long-term business reform, and have created a scalable platform that will allow for future growth whilst also raising our operating margin over the medium term.
A second international business challenge was how we might strengthen our ability in new domains, and raise our top line, namely, gross sales. Our acquisition of Merkle Group Inc. in August 2016 provided us with a market leading data driven, tech enabled performance marketing agency specializing in people-based marketing. Integrating Merkle’s advanced services and technologies into our own global network has allowed our brands to deliver unique, personalized customer experiences across platforms and devices, building competitive superiority. Continued integration of our services, sharing the knowledge and experience we have gained across countries and brands, raises the value of the solutions we provide to our clients.
A third initiative of our international business in FY2018 involved reinstating our performance-based incentive system, investing in our people, the Group’s greatest asset. The race to acquire human resources with sophisticated skills related to digital technology and data analytics is intensifying and crossing industry boundaries. Maintaining our competitive advantage whilst attracting and retaining talent remains a challenge – one we address through investing in our people through our Skills Academy platform.
FY2018 Operating Performance
A review of our 2018 operating performance shows that our reforms advanced while our top line steadily rose.
The expenditures incurred to undertake the reforms were related to current measures, but also future investment. Thus, I
believe that some time will pass before we can see the effects on our operating performance. In the meantime, our underlying operating profit fell, a phenomenon that I discuss below.
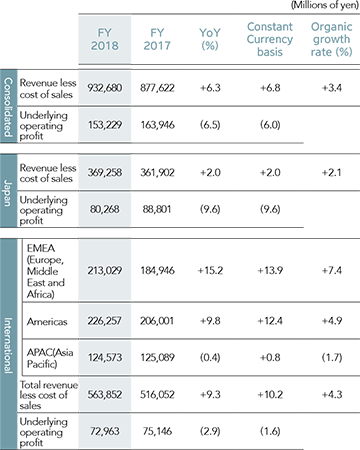
Our consolidated revenue less cost of sales rose 6.3%
year on year in FY2018, to ¥932.6 billion. The increase was due to a combination of Japan and international organic growth (up ¥30.6 billion year on year) and the effects of overseas acquisitions (up ¥28.6 billion).
Our year-on-year
growth in consolidated revenue less cost of sales on a constant currency basis, which excludes the impact of foreign exchange rates (down ¥4.2 billion year on year), was 6.8%.
Meanwhile, our consolidated underlying operating profit was
¥153.2 billion (down 6.5% year on year; down 6.0% on a constant currency basis). This decline was due, in part, to increased costs associated with domestic working environment reforms and planned infrastructure spend to support the new
growth phase in our international business.
Next, I will explain how these figures break down according to region.
In our domestic business, we saw a revenue less cost of sales of ¥369.2 billion (up 2.0% year on year), primarily
thanks to contributions by subsidiaries. The organic growth rate was 2.1%, with particularly large expansion in the digital domain, which accounted for 23.9% of domestic revenue less cost of sales (up 1.7 points year on year). Our
underlying operating profit was ¥80.2 billion (down 9.6% year on year) due to planned expenses related to working environment reforms and the establishment of corporate infrastructure.
In our international business, the growth momentum
we have maintained since forming the Dentsu Aegis Network in 2013 came to a temporary standstill in 2017. However, in FY2018, revenues returned to growth driven by new accounts won during the previous year.
As a result, the overall
revenue less cost of sales of our international business was ¥563.8 billion (up 9.3% year on year; up 10.2% on a constant currency basis), while its organic growth rate was 4.3% year on year. The digital domain accounted for 60.6% of
revenue less cost of sales in international business (up 2.7pp year on year; same on a constant currency basis), while the underlying operating profit was ¥72.9 million (down 2.9% year on year; down 1.6% on a constant currency basis).
By region, the revenue less cost of sales for the Asia– Pacific area was almost flat, falling 0.4% year on year (a 0.8% increase on a constant currency basis, with an organic growth rate of -1.7%). However, the Group’s performance was
strong in Europe, the Middle East and Africa, recording 15.2% (13.9% on a constant currency basis, with an organic growth rate of 7.4%). Also, in the Americas, we grew by 9.8% (12.4% in on a constant currency basis, with an organic growth
rate of 4.9%).
*Underlying operating profit: A profit indicator that measures recurring business performance. It is calculated by subtracting depreciation of intangible assets associated with acquisitions, M&A-related expenses and share-based compensation expenses attributable to acquired companies, as well as temporary factors including impairment loss and gain/loss on sales of noncurrent assets, from operating profit.
Phase 2: FY2019–20 Group Business Reforms
Were we to compare the 2017–18 overhaul of our business foundations to an Operating System update, we could then compare investment in growth we expect to conduct in 2019–20 to installing the applications running on that new Operating
System.
Through establishing workstreams and knowledge sharing between our domestic and international businesses, we will enrich capabilities from a Group-wide perspective.
To this end, we will accelerate investment in external
opportunities in Japan and continue our overseas M&A investments strategy.
Efforts to strengthen our domestic digital domain business foundations include the absorption of SEPTENI HOLDINGS CO., LTD. and VOYAGE GROUP Inc. into the Dentsu
Group in October 2018. The former was achieved through a capital and business alliance, and the latter through a business merger by integrating it with Cyber Communications Inc.
Through collaboration with these companies, we aim to
provide the highest level of service possible in the field of digital advertising. The Dentsu Group will collaborate within the solutions, advertising, and digital technology domains to solidify its position in the Japanese market. In our
international business, we aim to enhance our competitive advantage and secure continuous topline growth through persistent innovation and greater integration of our services.
Further, we will re-examine and rebuild our business lines,
simplifying our offer, appropriate for an era of datadriven marketing. In addition, I want us to view the wave of digital and societal reforms as our biggest opportunity to establish growth momentum.
Dividends: Capital Policy, Philosophy

When pursuing sustainable profit growth, our capital allocation priority is continuous and proactive investment in the domestic and overseas growth areas.
While recognizing the need for management stability and financial soundness, we
believe corporate digital transformation represents a huge opportunity for us. By investing in the creation of further business opportunities, we aim to help Group businesses expand, and so raise our intrinsic corporate value.
At the
same time, fully aware of the importance of shareholder returns, we will ensure comprehensive shareholder returns by combining steady dividends with opportunistic share buy-backs (table 4), while aiming for higher return on equity over the
medium term.
While we consider steady dividends to be important, we make decisions regarding dividends based on factors including consolidated business results, financial conditions, and the retained earnings necessary for investment in
business growth.
As a result of these considerations, we paid a FY2018 dividend of ¥90 per share (payout ratio of 26.0%). Although we project that our underlying net profit will decrease in 2019, we are planning to increase our dividend
by ¥5 per share and predict that the payout ratio will increase to 28.1%, continuing our track record of improving dividends and payout ratios that we have maintained since 2015.
Thank you for your continued support of the Dentsu Group.
